On Chain Bitcoin (OCB) Indicator - News
Why we need a valid On Chain Indicator
We love technical chart analysis. It is especially good at capturing and mapping emerging momentum. However, it cannot provide information about the fundamental valuation of an asset.
However, when evaluating the current Bitcoin price, the fundamental valuation is an absolute must if you want to understand and predict the correlations of past and future price developments.
The fundamental analysis of Bitcoin is based on the so-called on-chain data. In total, more than 140 variables are available here - starting with the supply, via the number of active addresses to the hash rate of the miners and many more.
Many of these indicators have no real influence on the price - others are too closely linked to the price to be able to provide fundamental information on the valuation.
Demand Supply Model
As with other assets, including gold, silver and other commodities, there are certain models to calculate the fair price. These are based on supply and demand.
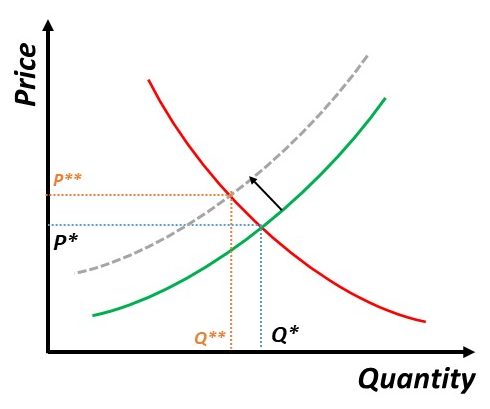
These considerations play a central role for our indicator.
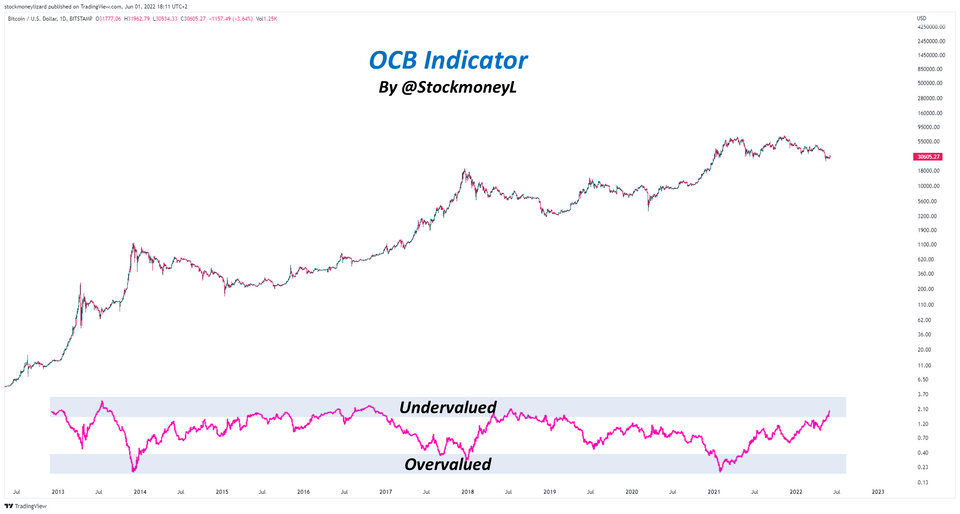
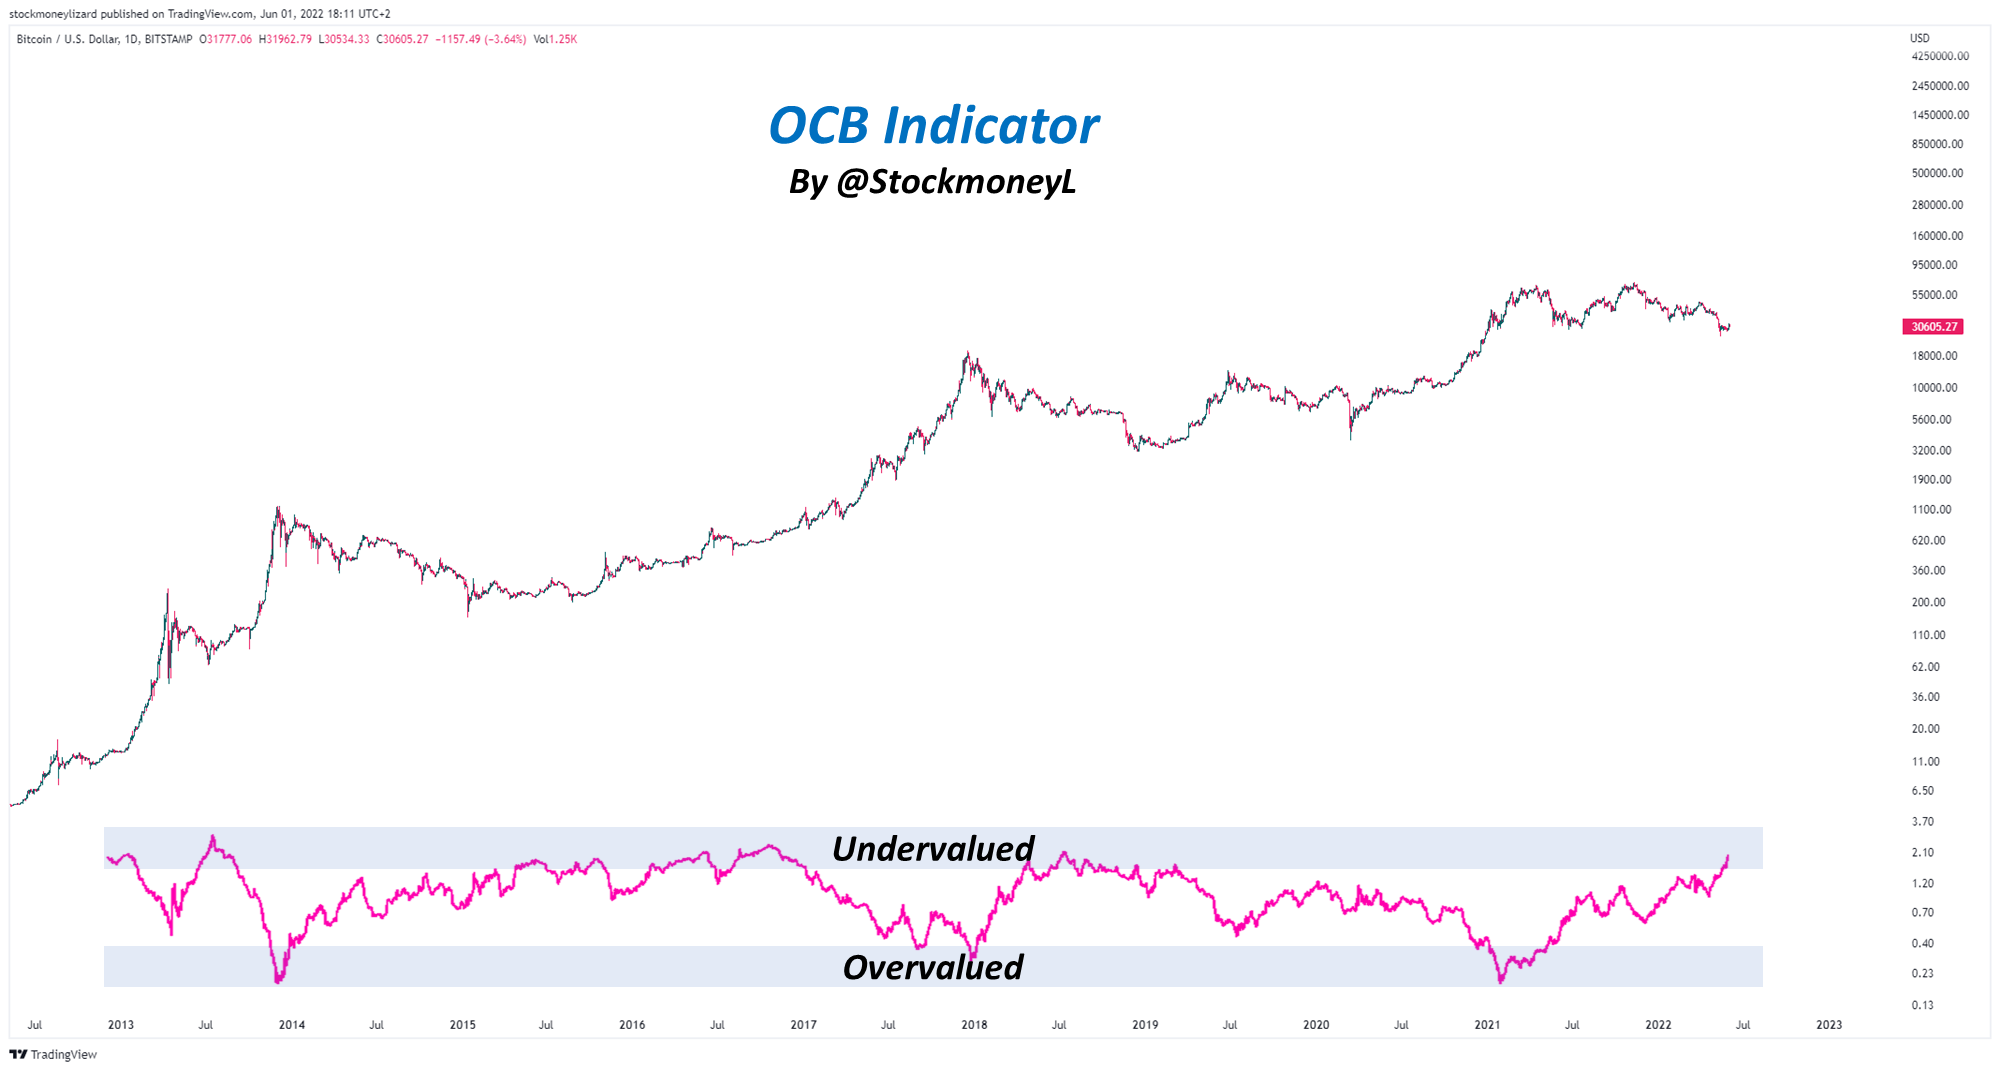
On Chain Bitcoin (OCB) Indicator
For our OCB indicator, we first catalogued the Bitcoin price according to common models regarding accumulation and distribution phases. Subsequently, we performed a multivariate regression analysis, which gave us 4 variables that have an independent, highly significant (p < 0.01) impact on these valuation phases.
- Capitalization, MVRV, current supply
The ratio of the sum USD value of the current supply to the sum "realized" USD value of the current supply. - Supply, active, 30d
The sum of unique native units that transacted at least once in the trailing X up to that day. Native units that transacted more than once are only counted once. - Network distribution factor
The ratio of supply held by addresses with at least 1/10000 of the current supply of native units to the current supply. - Velocity, current supply, 1 year
The ratio of the value transferred (i.e. the sum of all ransfers) in the trailing 1 year divided by the current supply up to the end of that interval. This one is a measure that depicts the turnover rate (number of times a native unit has been transferred in the past year).
(Definitions are from https://docs.coinmetrics.io/info/metrics)
These 4 variables, which represent supply and demand, were now combined in a mathematical model and used to calculate an indicator.
The current update of our indicator shows that we are now once again at fundamentally undervalued levels.
DISCLAIMER: We may have beneficial long & short positions in the shares of the stocks presented here. We are long in Bitcoin. The posts here express our own opinions regarding trades. It’s no investment advice. We are not receiving compensation for it. We have no business relationship with any company whose stock is mentioned here. All stock chart and prediction models are our own work and we believe they may help to better understand future price movements, however, those are just models which may be influenced by external factors and may not become true. Investing in the stocks and coins presented here is risky and may and in a complete loss of fortune.

Member discussion