On Chain Bitcoin (OCB) Indicator - developed by Stockmoney Lizards
Over the last few weeks we have been working hard to bring you numerous Bitcoin technical analyses. We were able to identify some patterns and support our bullish sentiment with the help of oscillators and indicators.
But this is only one side of the coin: every technical analysis should be accompanied by a fundamental analysis. For stocks and companies, fundamental analysis is a bit more straightforward. But only at first glance: Due to the unique Bitcoin network, all on-chain data is available! These are a bit confusing at first glance and not all of these data are suitable for a fundamental analysis.
We have evaluated and screened over 140 variables in a multivariate analysis and developed our own on-chain indicator from several variables.

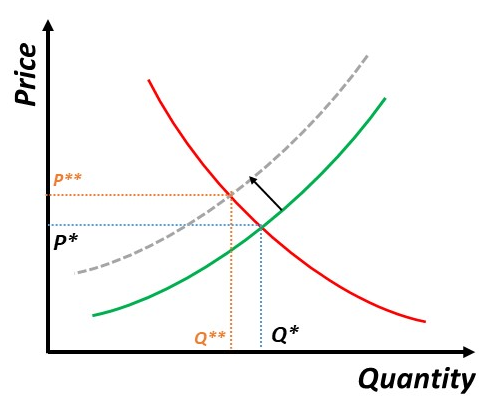
The content of our model is based on classic supply/demand models such as this one
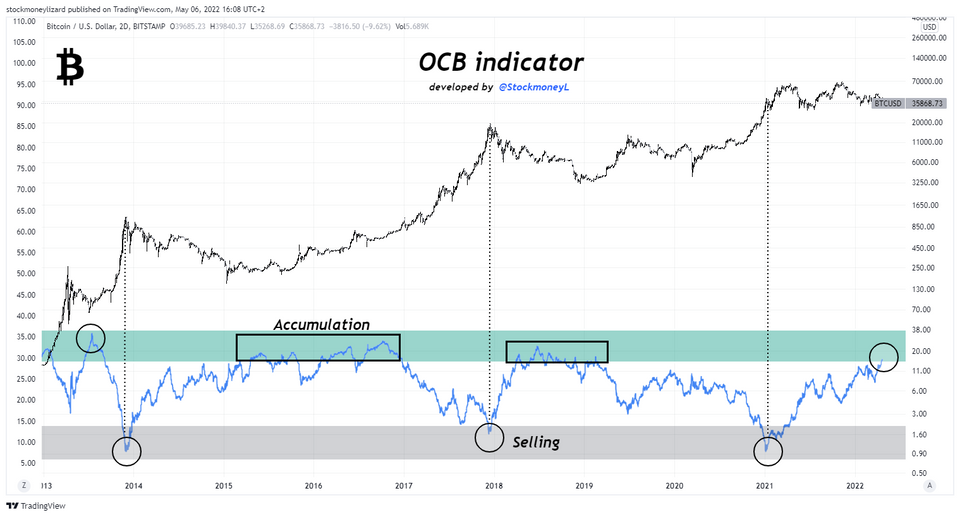
Here you can see the current Bitcoin chart, daily timeframe from 11 / 2012 to 05 / 2022 together with our OCB indicator.
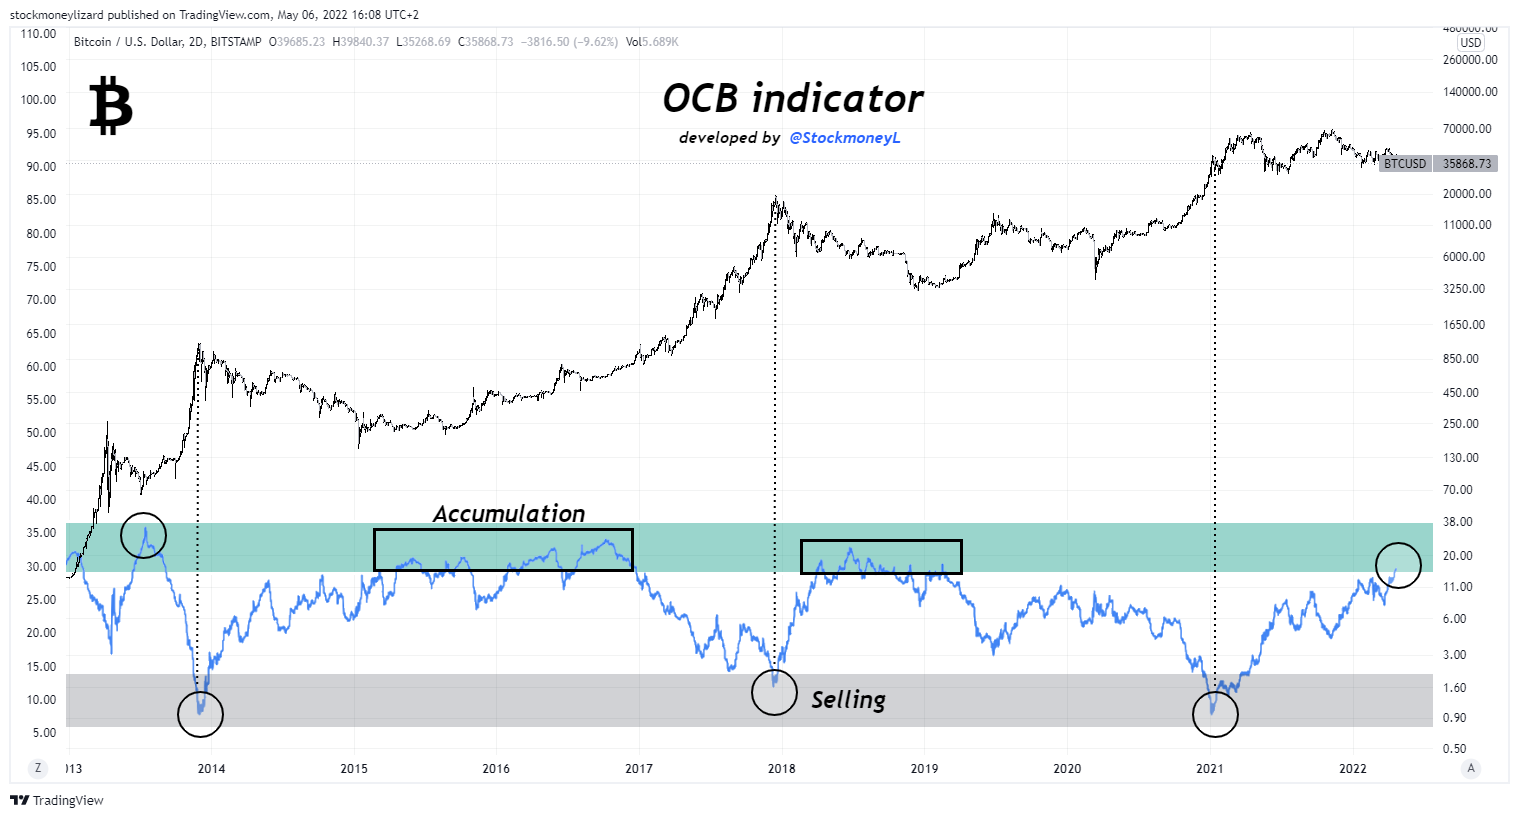
We will continue to work on the indicator and try to optimize it. For now, we already get a good idea of where we are standing right now.
DISCLAIMER: We may have beneficial long & short positions in the shares of the stocks presented here. We are long in Bitcoin. The posts here express our own opinions regarding trades. It’s no investment advice. We are not receiving compensation for it. We have no business relationship with any company whose stock is mentioned here. All stock chart and prediction models are our own work and we believe they may help to better understand future price movements, however, those are just models which may be influenced by external factors and may not become true. Investing in the stocks and coins presented here is risky and may and in a complete loss of fortune.
Member discussion