Stockmoney Lizards Newsletter - Issue #5

Editorial
Dear stockmoney hunters, Bitcoin and biotech lovers,
an interesting stock market and crypto week lies behind us and a very exciting one ahead.
The biotech sector was able to stop its slide; the $XBI closed above the critical support of $91. And there is also an upward trend in Bitcoin.
At the same time, geopolitically there is still no relief in sight in the Russian-Ukrainian war. In addition, there was the expected interest rate increase of 0.25% by the FED - further interest rate increases to counteract inflation are to follow throughout the year.
These latest developments strengthen our view that the inflation-proof cryptocurrencies, first and foremost Bitcoin, as well as the biotech sector, which is only indirectly affected by the inflation figures, belong to the must-haves of every portfolio.
Premium advantages
As a novelty, today's edition will now be available in full to Premium members. In particular, we will elaborate on our portfolio, provide current trades and analysis, and cite further price developments and targets. Furthermore, in addition to the chart analyses shown on Twitter, we will also show additional content, which in particular goes into further detail on the short and medium-term trading strategy for our stocks and bitcoin.
Stay tuned, your lizards
#Altseason - And Bitcoin?
The hastag #Altseason is trending right now. But what does that mean? It means that if 75% of the top 50 alternative coins performed better than Bitcoin over the last 90 days. Does that mean we should shift our Investments to alternative coins?
We believe: no. Because fundamentally, Bitcoin is the one and only coin in our opinion (which doesn't mean you can't make some good money with altcoins). Also, we have been observing some interesting short- and mid-term trading-signals, that convinced us that Bitcoin may rallye soon. Here we are going to show you the technicals:
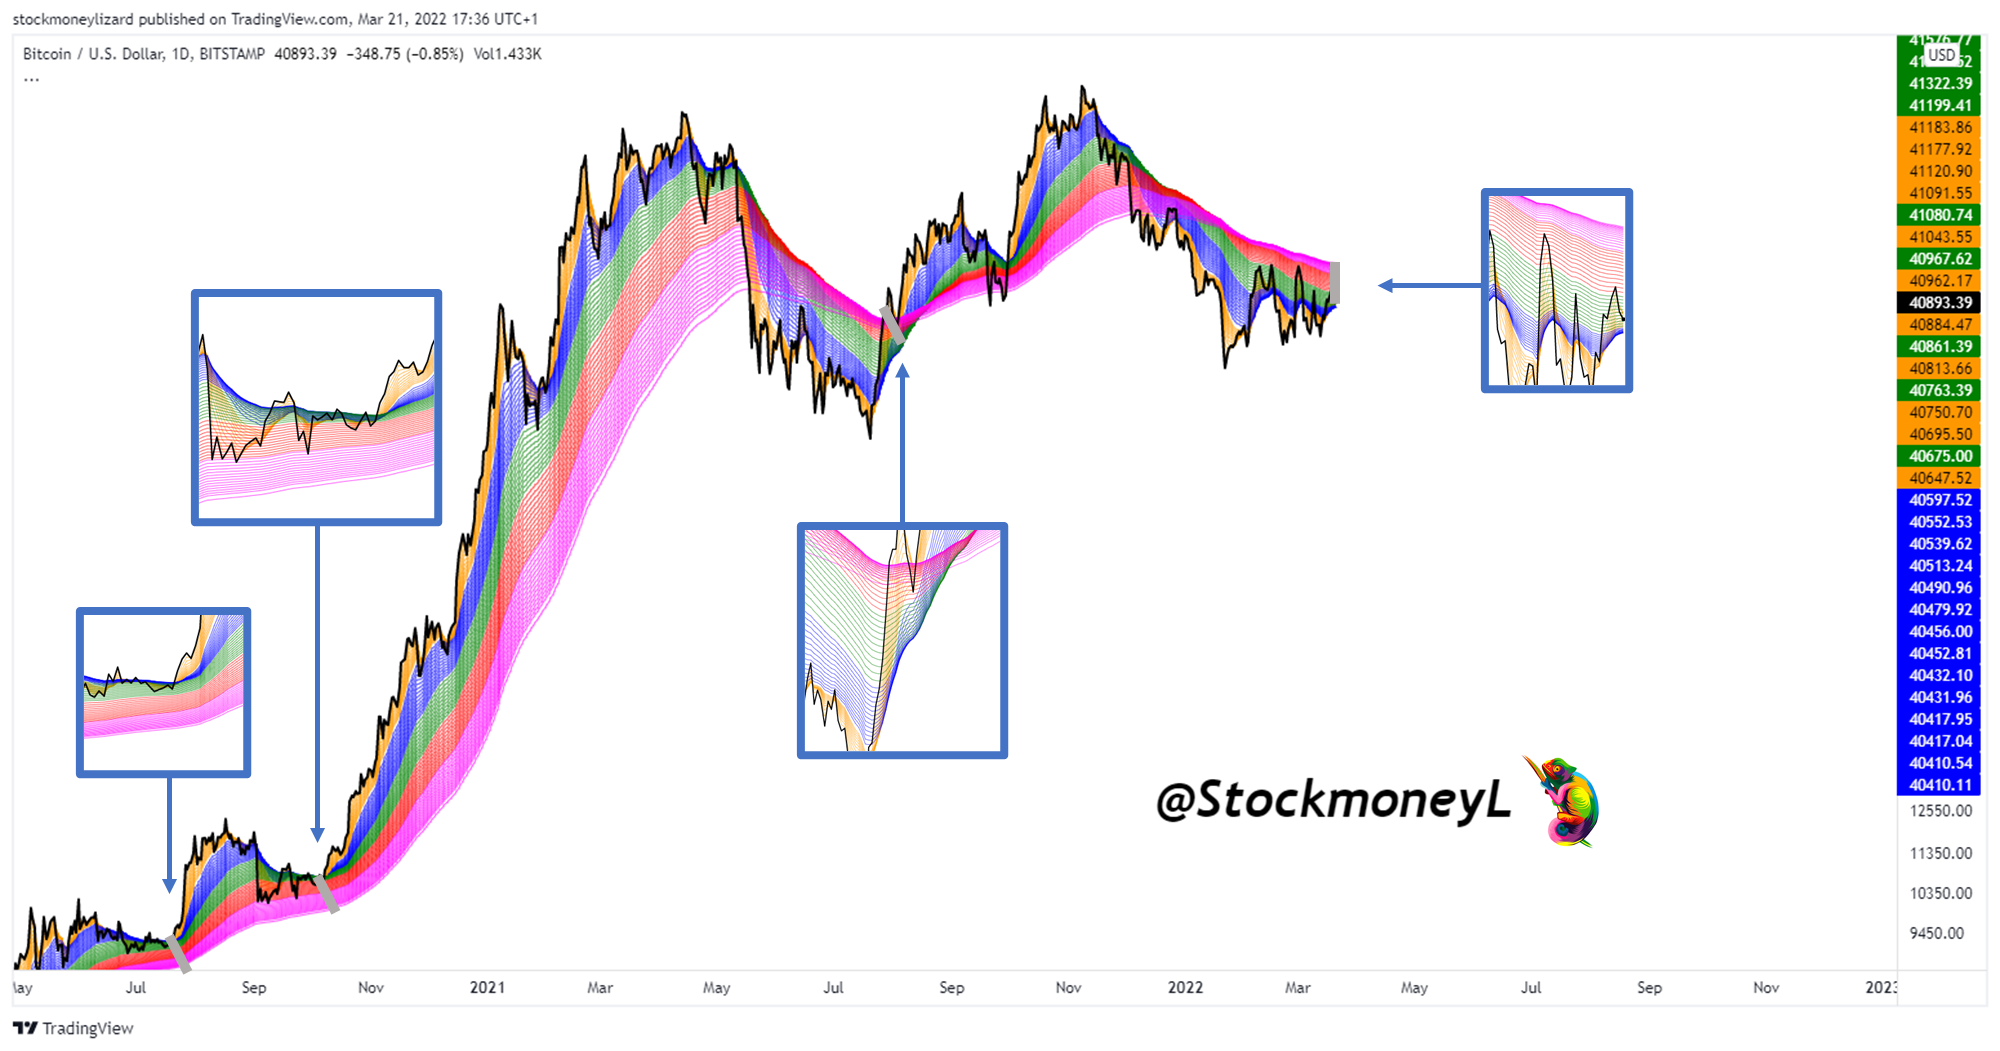
- EMA Bands narrowing
EMA (Exponential moving average) is an indicator that shows the average of the past trading period - typically set to 50 / 200 days. EMA as opposed to SMA (simple moving averages) is depicting the short-term price developments better than SMA. EMA bands are just a variety of different trading intervals starting from 2 and ending with 200 days. We've previously shown that EMA 12/50 crossing is a bullish signal. We're not quite there, yet. But we can clearly see that EMA bands are narrowing and the short-term bands (orange/blue) are approaching the long-term ones (red/purple) from below, indicating that we're bottoming at current price levels.
2. MACD inflection point
The Moving Average Convergence/Divergence (MACD) indicator is a momentum oscillator primarily used to trade trends. The MACD Inflection point in bearish phases has shown to introduce a new parabolic run. Currently, we've just passed this point.

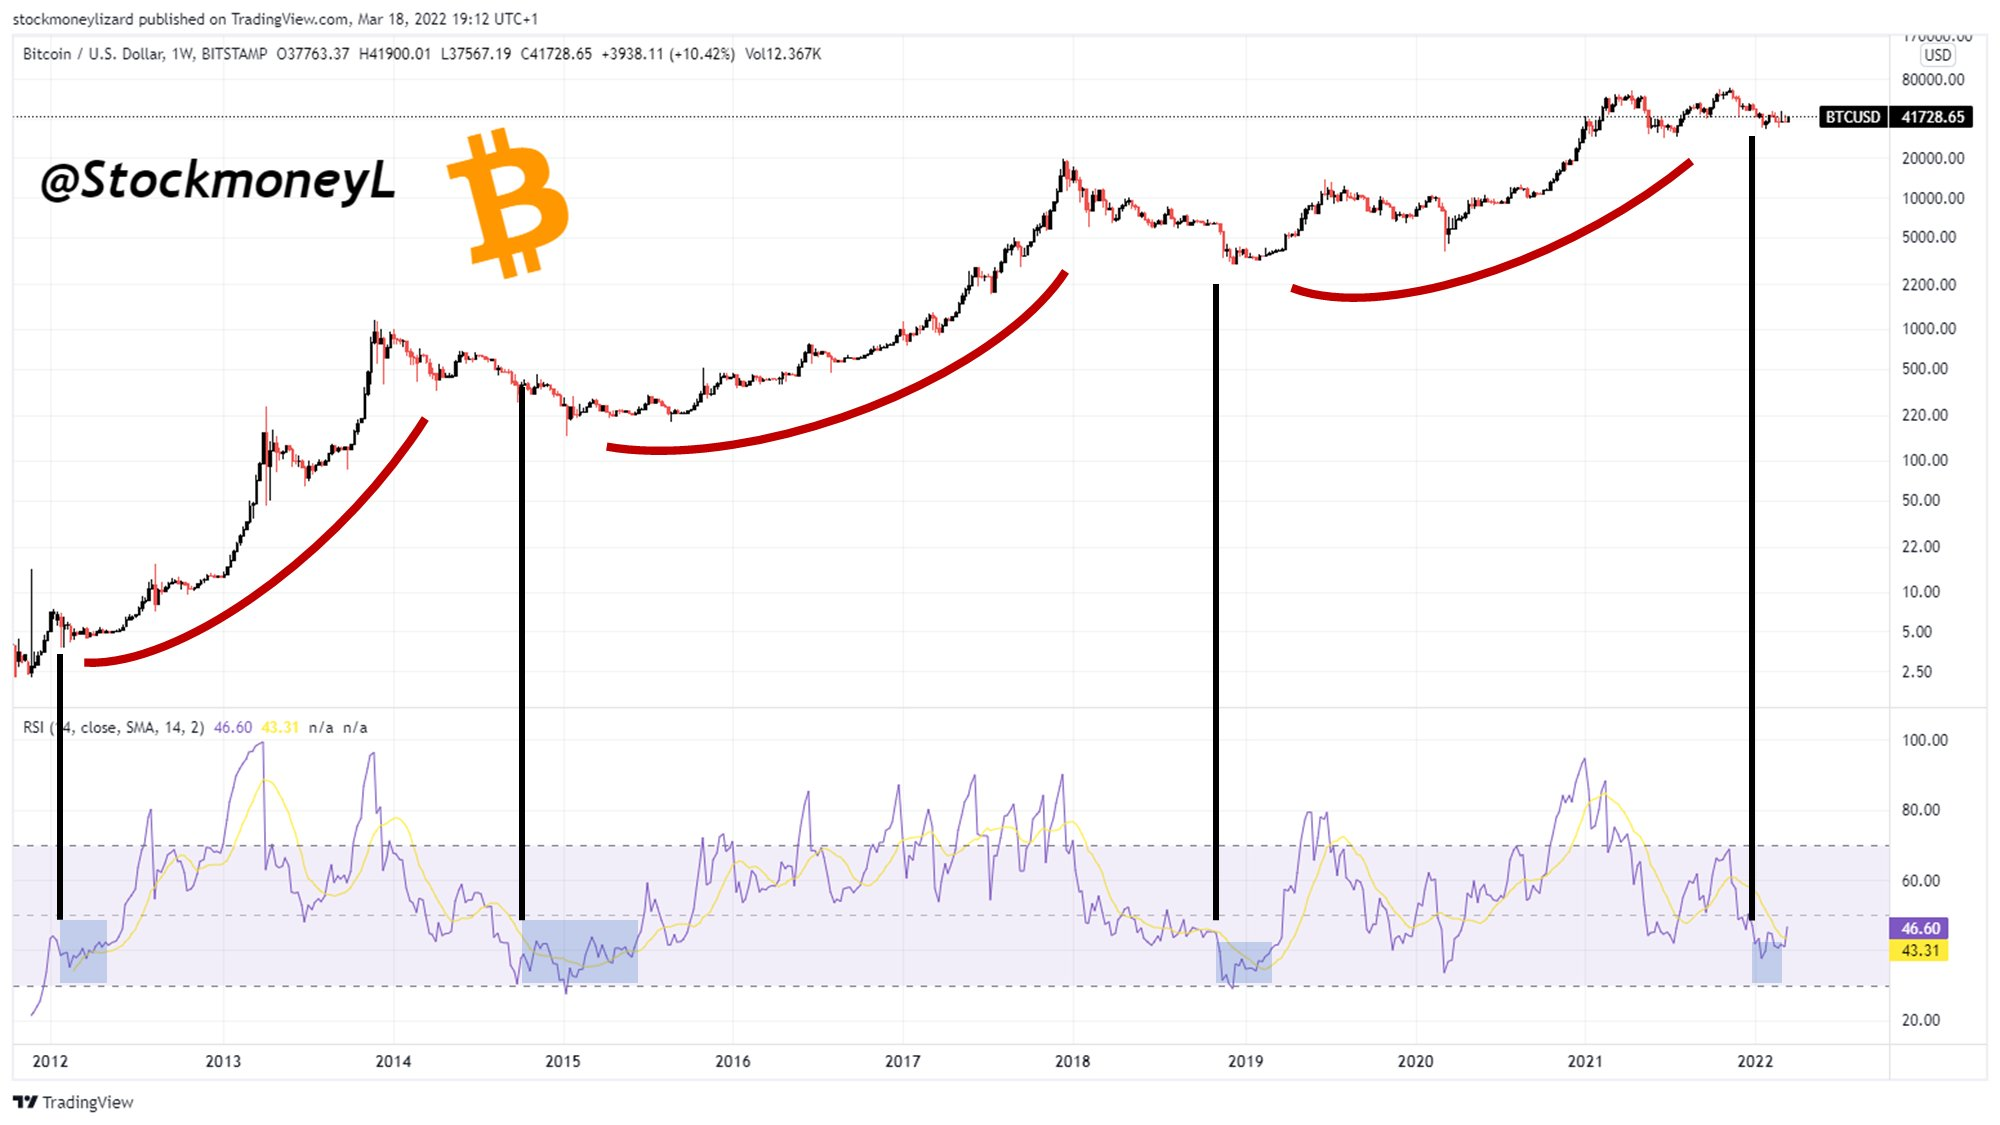
3. RSI 14 dipping to oversold territory has marked new legs up
RSI14 is an indicator showing if a stock/bond/currency is oversold or overbought. Lower numbers (<40) indicate the oversold region is reached. Whenever Bitcoin has dipped into this region, another parabolic run has been introduced. We see this as another ultra-bullish sign.
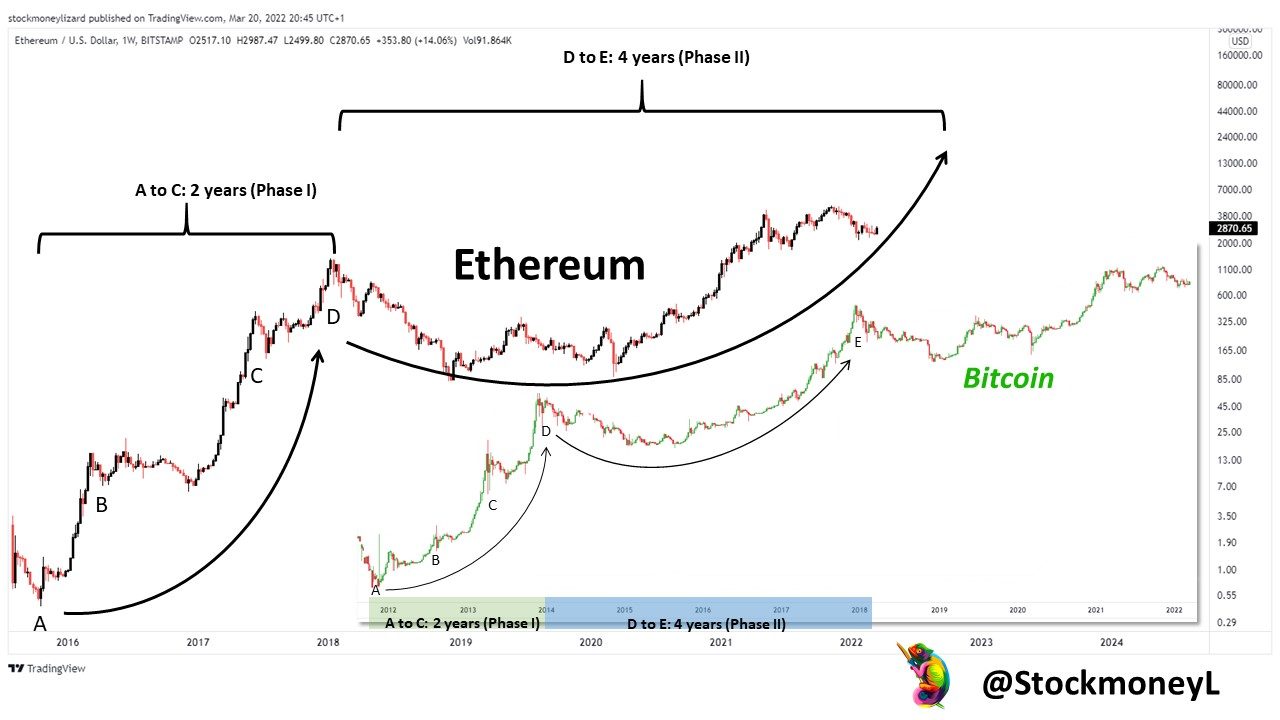
And Ethereum?
We have made a very interesting observation. So far, Ethereum is going through the same phases as Bitcoin. Phase I (A to C): 2 years Phase II (D to E): 4 years. We are thus convinced that Ethereum will mark a new high in 2022. We're bullish on both.
Conclusion:
We believe that, currently, Bitcoin accumulation is being performed. We believe in increasing prices in the near- and mid-term future. We are bullish.
Biotech Update
One week ago, we have shown the current trading scenario for the $XBI.
Our current $XBI TA and outlook for next week. There were numerous breakout attempts in the past weeks (EMA 12/50 crossing). Currently testing support line. Getting back $88.50 and $91 support/resistance levels next short-term aims. $SPY #Stockstobuy pic.twitter.com/Nx5ymEcrth
— Stockmoney Lizards ⚡️ (@StockmoneyL) March 13, 2022
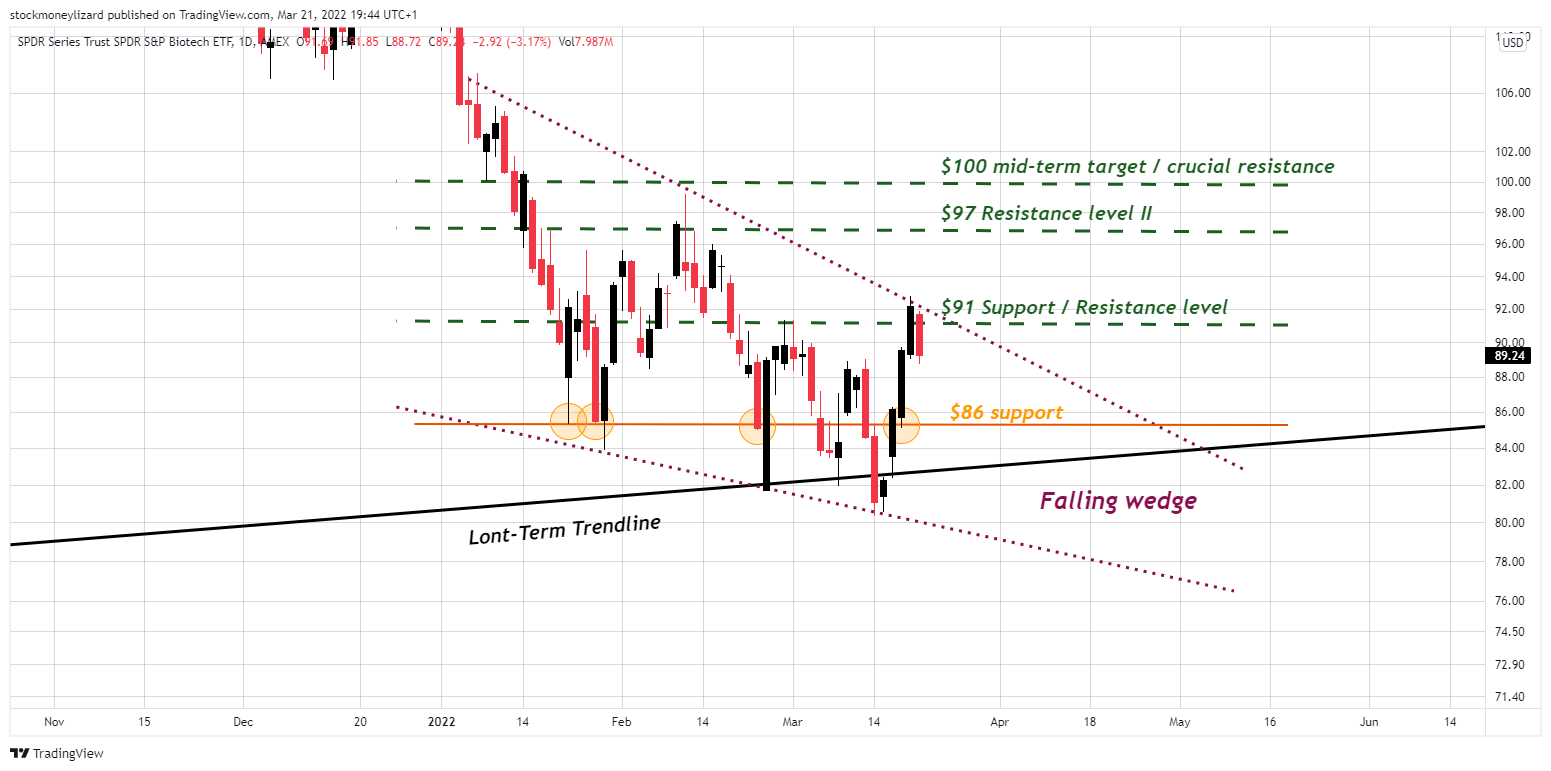
When it was dipping in and below the support zone for a short time, bears and pessimists were anxious about a further drop. However, $XBI stabilized and ran back up and even cracked the important resistance line of $91.
When it was dipping in and below the support zone for a short time, bears and pessimists were anxious about a further drop. However, $XBI stabilized and ran back up and even cracked the important resistance line of $91.
For the next week, there are some crucial support/resistance levels. We still believe the current formation is the beginning of the next bull market, with a beginning falling wedge forming. Alternatively, this is a bear flag and we're targetting the open gap at around $76. We think this is the by far more unlikely scenario. Crucial short-term aim is the $91 support / resistance line which is currently broken (while FED chair Powell is speaking ;)).
Sample portfolio - Follow our trades
Our sample portfolio was initiated on 24 February and is currently up 5.5%. The S&P500 has gained 3.5% in this time and the Nasdaq100 2%.
Current number of positions: 6.
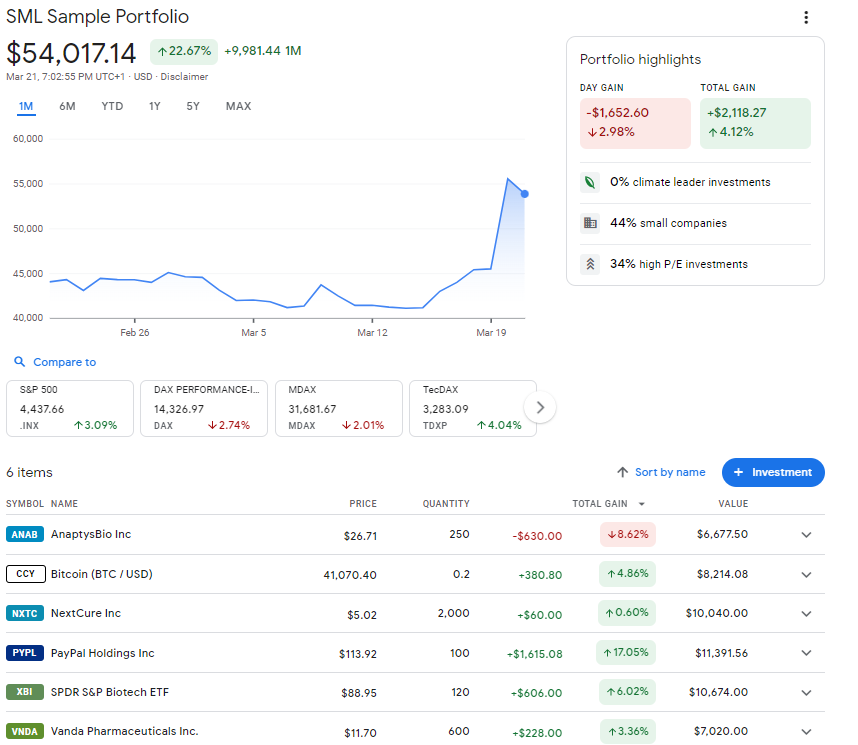
$ANAB: Last week, we added 50 shares of $ANAB @26.70 after the Phase 2 fail. There was strong support at the crucial 61.8 Fibonacci retracement. Yesterday, there were the news that a new interim CEO is taking over. We remain fundamentally bullish and wait to buy more. Mid-term target $40.
$PYPL: Has made some nice gains (~18%) in one week. We remain on board, our current position is untouched. Target: $130 before we start reducing. We buy below $100.
$BTC: sideways movement channel is getting narrower. We believe a breakout is imminent. We stay on board and increased our position today by 0.05 BTC at 40.6k.
$XBI: We stay onboard. One of our long-term investments. We may buy more below $82 / $80. Trading zones and targets see above.
$VNDA: No news or new developments. We believe the stock is bottoming right now. No change.
New position: NextCure Inc. (NXTC); added 2000 shares @$4.99
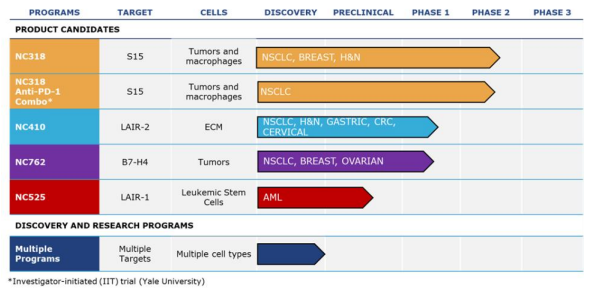
About NextCure:
Nextcure is one of those beaten-down biotechs that we believe is currently massively undervalued. The company focuses on the development of oncology drugs for the treatment of various cancer types. NXTC has a unique platform called FIND-IO that seeks to functionally assess immune pathways in both primary immune cells and established cell lines from immune lineages. The aim is to identify novel cell surface molecular interactions that drive functional immune responses in the tumor microenvironment and other disease sites.
The position is per se rather risky, since it is a small cap biotech company with no revenues so far. However, NXTC is secured by its huge cash position and there is currently only little downside. As of now, we estimate cash and cash equivalents to be around $210 million with a market capitalization of only around $140 which translates to an enterprise value of - $70!
The outlook for 2022 is great, especially with the biotech sector that is about to have a comeback. In the last Q4 conference call, Michael Richman, CEO, said: “In 2021, NextCure set the stage for multiple data readouts in 2022. This year, we intend to have important updates on NC318, NC410, and NC762. Additionally, we expect our year-end cash position of $219.6 million to fund us into the first quarter of 2024.”
Conclusion:
We believe in the value of the pipeline. License deals with big pharma may be completed throughout the year. The data published so far make us confident that further readouts will make the stock price rise. We buy below $5. Target price $7 (upside of 40%)
Disclaimer:
We may have beneficial long & short positions in the shares of the stocks presented here. We are long in Bitcoin. The posts here express our own opinions regarding trades. It’s no investment advice. We are not receiving compensation for it. We have no business relationship with any company whose stock is mentioned here. All stock chart and prediction models are our own work and we believe they may help to better understand future price movements, however, those are just models which may be influenced by external factors and may not become true. Investing in the stocks and coins presented here is risky and may and in a complete loss of fortune.
Member discussion