Stockmoney Lizards Newsletter - Issue #4
Editorial
Dear stockmoney hunters, Bitcoin and biotech lovers,
The past week at the stock markets was characterized by major fluctuations in response to various geopolitical events. Days in which fears of nuclear catastrophe were reflected alternated with days in which hopes of an imminent de-escalation of the Ukraine conflict were raised.
On Friday, there were first signals from Moscow regarding a possible de-escalation, which the markets promptly celebrated with rising stock prices.
Beside that, the FED published the inflation figures, these are currently at a 40-year high which is mainly due to the rising gas prices. Accordingly, there will be further interest rate hikes which are also bad for the economy and market sentiment (Link https://www.reuters.com/business/futures-fall-inflation-nerves-amid-ukraine-crisis-2022-03-10/)
Of course, these developments are holding the biotech segment down as well, although we don’t see a direct impact on the biotech segment. The $XBI shows relative strength and our two stock picks ANAB and VNDA have not marked any further lows. And as far as Bitcoin is concerned: the above-mentioned developments are fundamentally supportive for Bitcoin and cryptocurrencies, so that we also see ourselves prepared for the next rally.
In this current issue of our newsletter, we want to focus on macro trends and show you where we see current price targets and which are the best stocks to buy right now. Last week, we posted some technical analysis which we will further elucidate here and show you what the implications are. Within the next week, we’ll also present to you a new stock pick added to our portfolio. Let’s go!
Stay tuned, your Lizards
Index
- Bitcoin short- and long-term outlook
- Sample portfolio - Follow our trades
- Biotech weekly roundup
Bitcoin short- and long term assessment

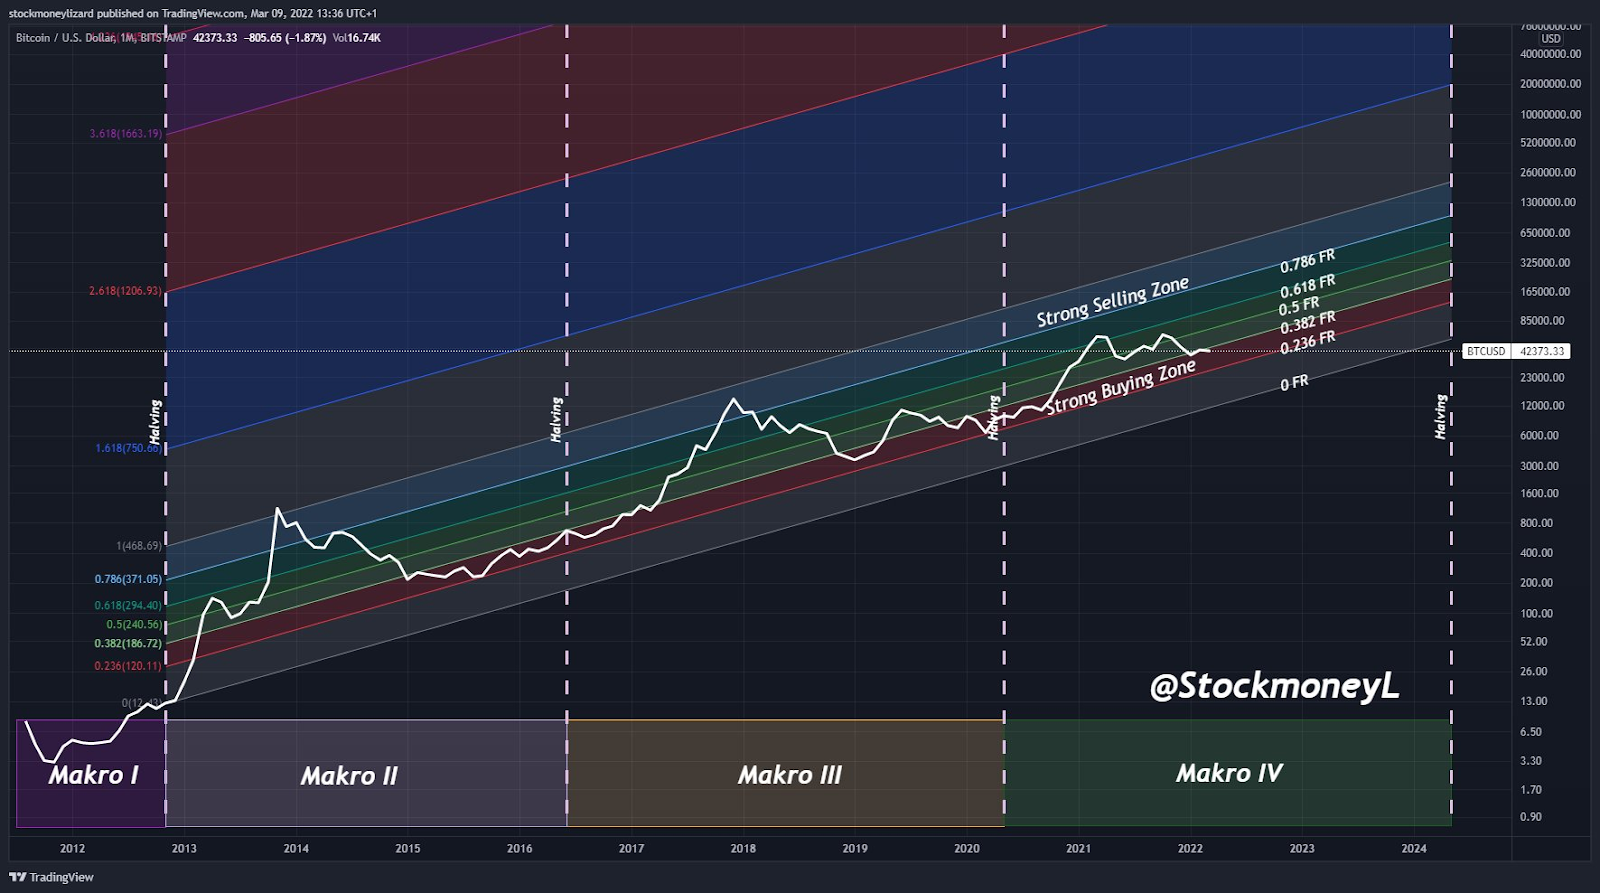
When looking at the 10-year Bitcoin chart we can divide it into 4 different macro zones based on halvings (Figure 1). It is obvious that the Bitcoin price follows an uptrend channel with highs and corrections. These swinging highs and lows follow mathematical rules that we can make visible by applying the Fibonacci Channels. The region between 23.6 and 38.2 Fibonacci is considered the strong buying zone. The Bitcoin price hardly drops below this trading channel. Between 78.6 and 100 Fibonacci zone is considered the strong selling zone - The price usually peaks here and drops sharply, such as in Nov 2013 and Dec 2017. This week, when Bitcoin crossed the 42k line, we were testing to leave the strong buying zone. On thursday and friday (10/11 March), there was, however, a setback which put it back in the lower trading channel.
In addition, there are other patterns that can be seen in the Bitcoin chart (Figure 2). When the Bitcoin price is plotted logarithmically, there is a long support line that is tested again and again after various highs. You can clearly see a strong support in this area and we are currently back in one. Interesting.
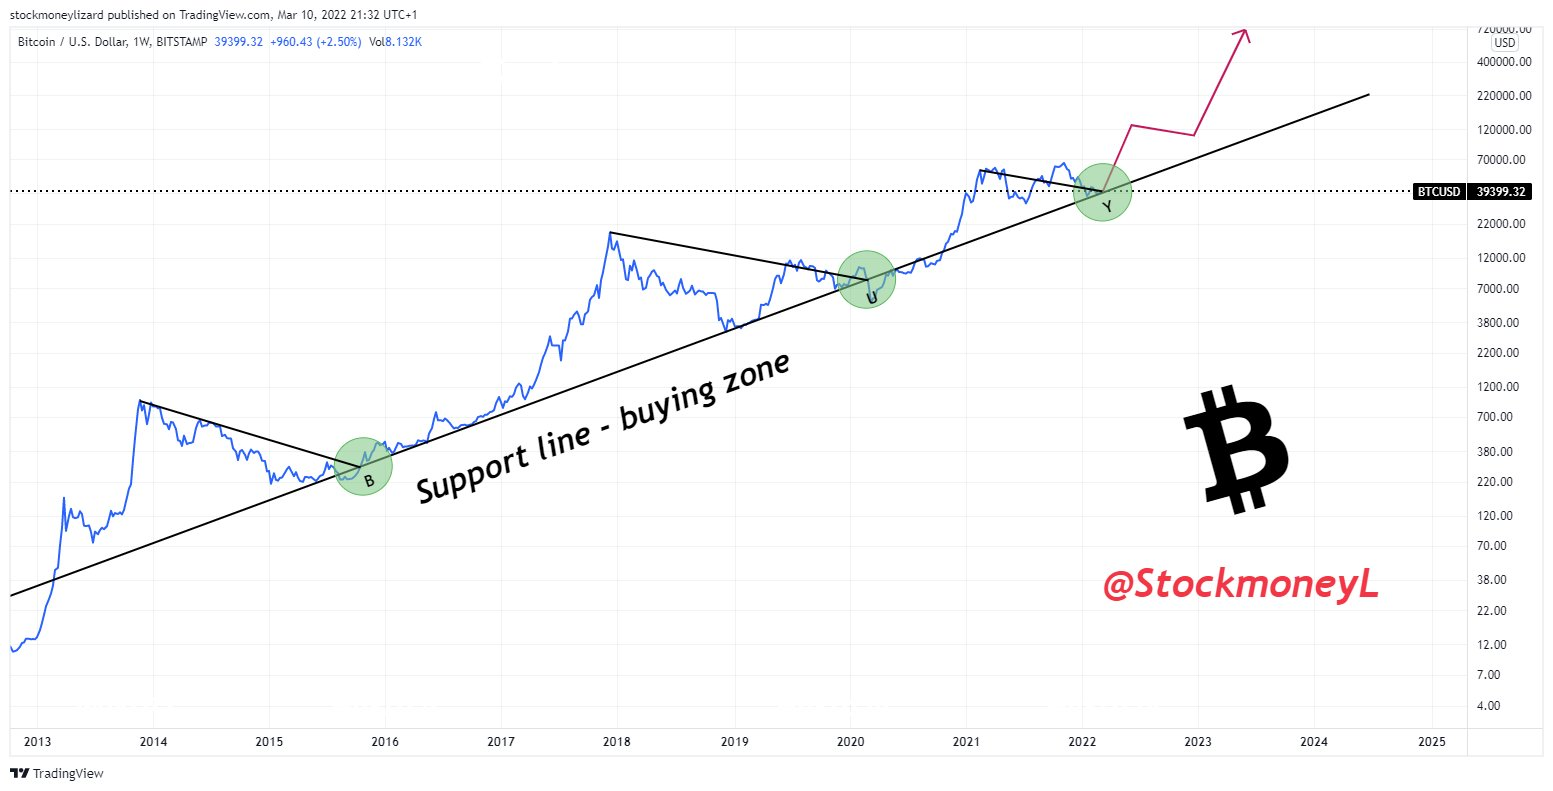
So, sooner or later, BTC will make another attempt to leave the current zone and reach new highs. So the question is now: where are we heading in the short-term?
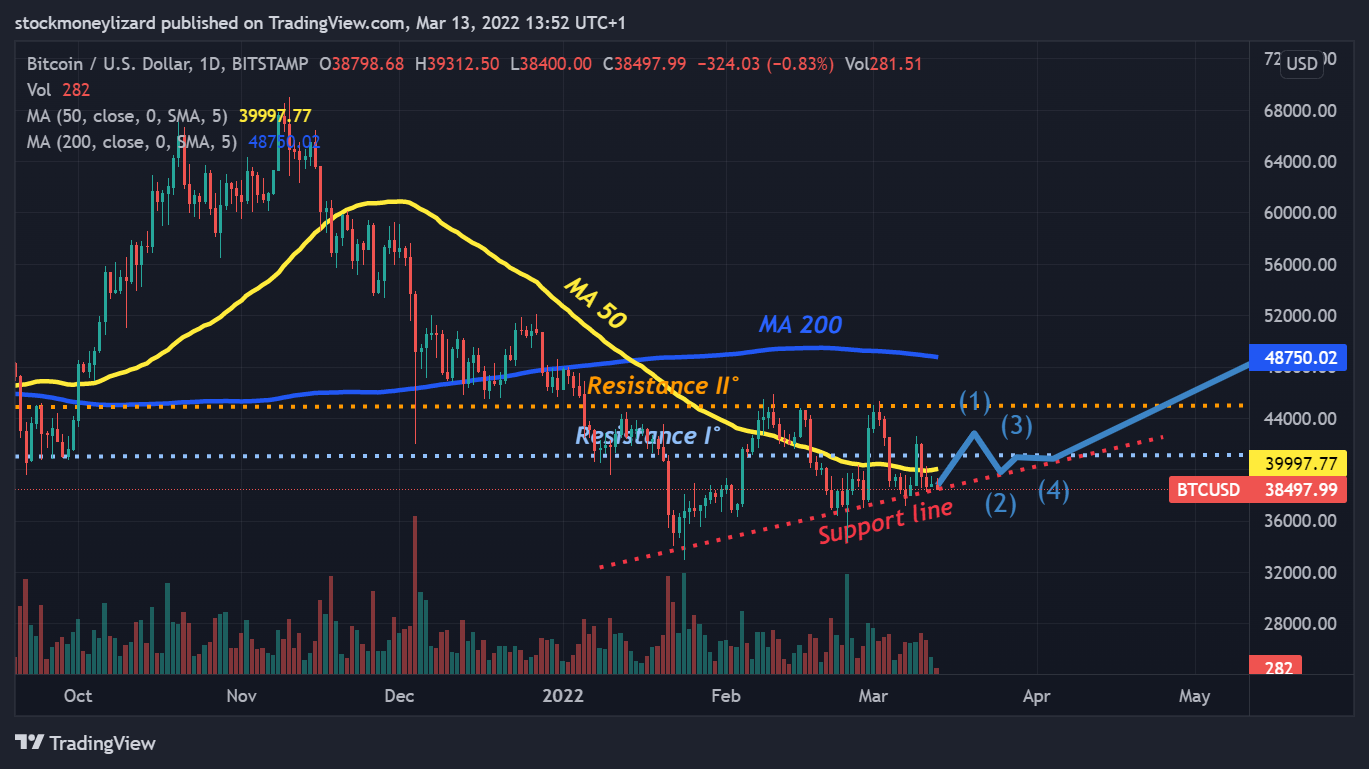
Let’s take a look at a chart that we posted last friday (Figure 3). We can see the support line (red) that is limiting the lows. There are false breakouts towards lower prices that are corrected within a very short amount of time (usually hours up to one day). There are two important resistance lines:
Resistance level I° (~41k) and level II° (~45k). The current BTC price has bounced off MA 50 recently - this is another important resistance line that will become the new support once we break through it. Nonetheless, the current setup clearly shows a narrowing of the trading channel. We expect a short-term breakout of this zone.
Sample portfolio - Follow our trades
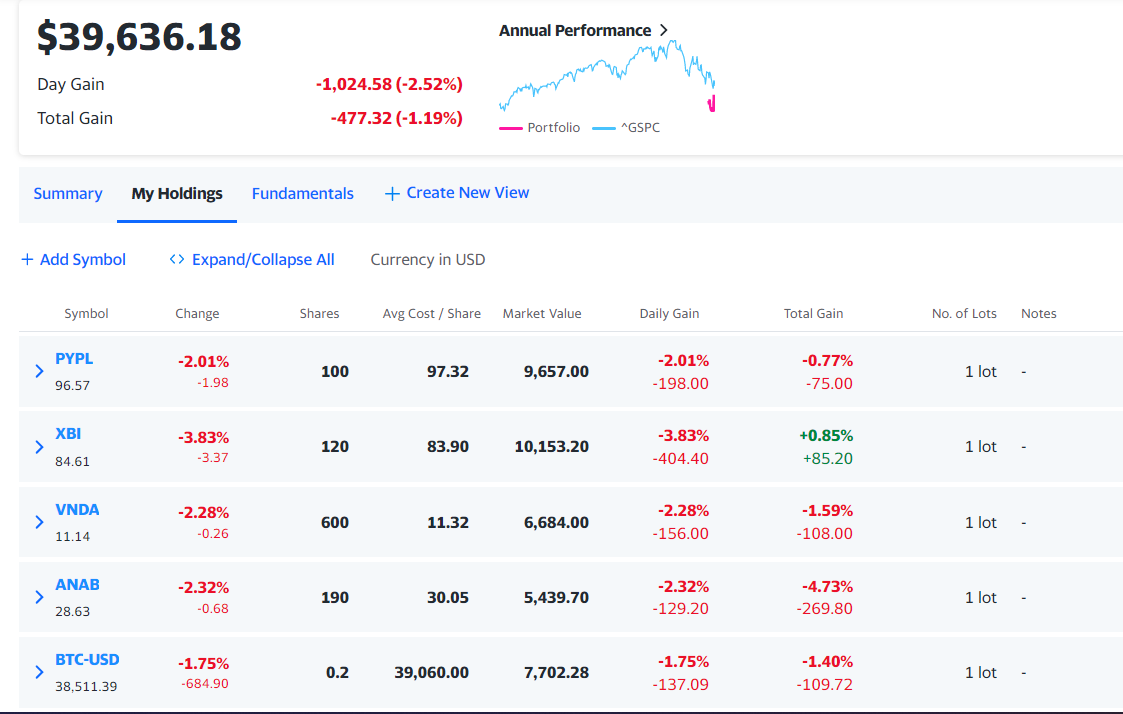
Our current portfolio contains Paypal ($PYPL), AnaptysBio ($ANAB), Vanda Pharmaceuticals ($VNDA), and Bitcoin ($BTCUSD). The whole portfolio is currently down -1.19% after the drawback day on friday, while we do outperform the market. We remain confident with our portfolio strategy and will be adding another position during the next week.
Updates on our investments
AnaptysBio
On Monday, 7 March, the company announced fourth quarter and full year 2021 financial results and provided an update on the developmental stage pipeline (Link: https://ir.anaptysbio.com/news-releases/news-release-details/anaptysbio-announces-fourth-quarter-and-full-year-2021-financial).
To sum it up, AnaptysBio is on track with it’s pipeline progress. CEO Hamza Suria said: “We advanced our wholly-owned antibody product pipeline and completed a $250 million royalty monetization transaction during 2021. We look forward to multiple clinical data readouts during 2022 and remain focused on developing first-in-class therapeutic antibodies using a capital-efficient business model.”
There were no surprises in the Q4 report which is a good thing. The company remains on track and we reiterate our bullish rating!
Comment: On 14 March 2022, AnaptysBio reporteted negative Phase 2 data on Imsidolimab (anti-IL-36R Ab) in moderate to severe Acne. However, we remain VERY #Bullish, see our tweets:
$ANAB Imsidolimab P2 fail in acne. May be dropping ~20-25% tmrw in the current markets. Mid-term: weakest indication / reducing burn / instit. support. Still #BULLISH https://t.co/wDHFFjym4P pic.twitter.com/9sKFfN1WEZ
— Stockmoney Lizards ⚡️ (@StockmoneyL) March 14, 2022
$ANAB - our currently favourite smid cap #biotech bounced off well 61.8 Fibonacci Retracement support after recent P2 fail. Very solid company, strong institutional support. $XBI $SPY $QQQ pic.twitter.com/lkEzorCyEQ
— Stockmoney Lizards ⚡️ (@StockmoneyL) March 18, 2022
We were confirmed in our view since the drop was only temporary and very mild.
Vanda Pharmaceuticals, Paypal: no news this week.
Biotech weekly roundup
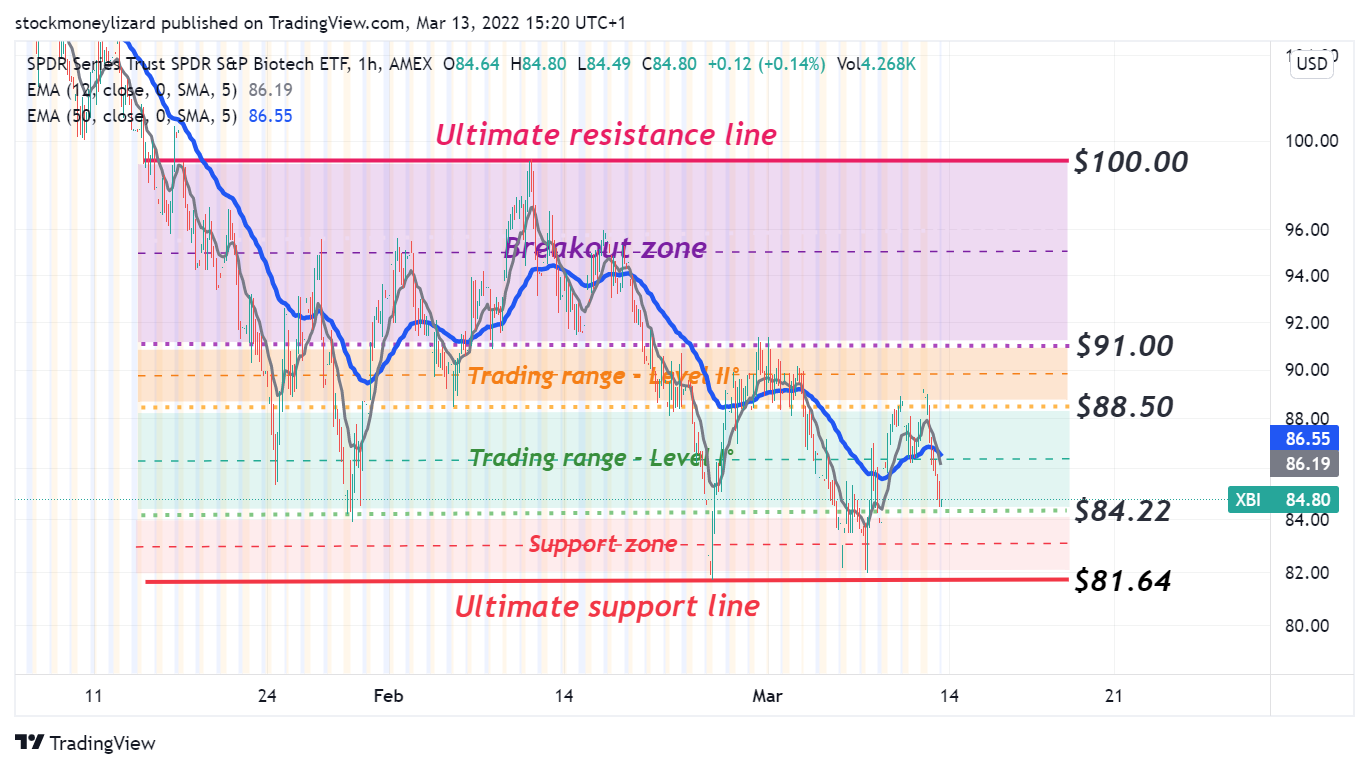
On thursday, 10 March, there was another attempted $XBI breakout above the orange line (Figure 5). On friday we closed again near the old support line (green line). Currently, we see relative strength of the biotech sector with no new lows. Interestingly, EMA 12/50 crossing, which is an ultimately bullish signal, has been observed several times during the past weeks (e.g. on 31 Jan or 7 Feb). However, this bullish sentiment was not lasting due to the geopolitical crisis as well as to high inflation numbers.
Conclusion:
$XBI with relative strength, keeping current support levels. Next week will be interesting. We are optimistic for a new attempt to break resistance levels.
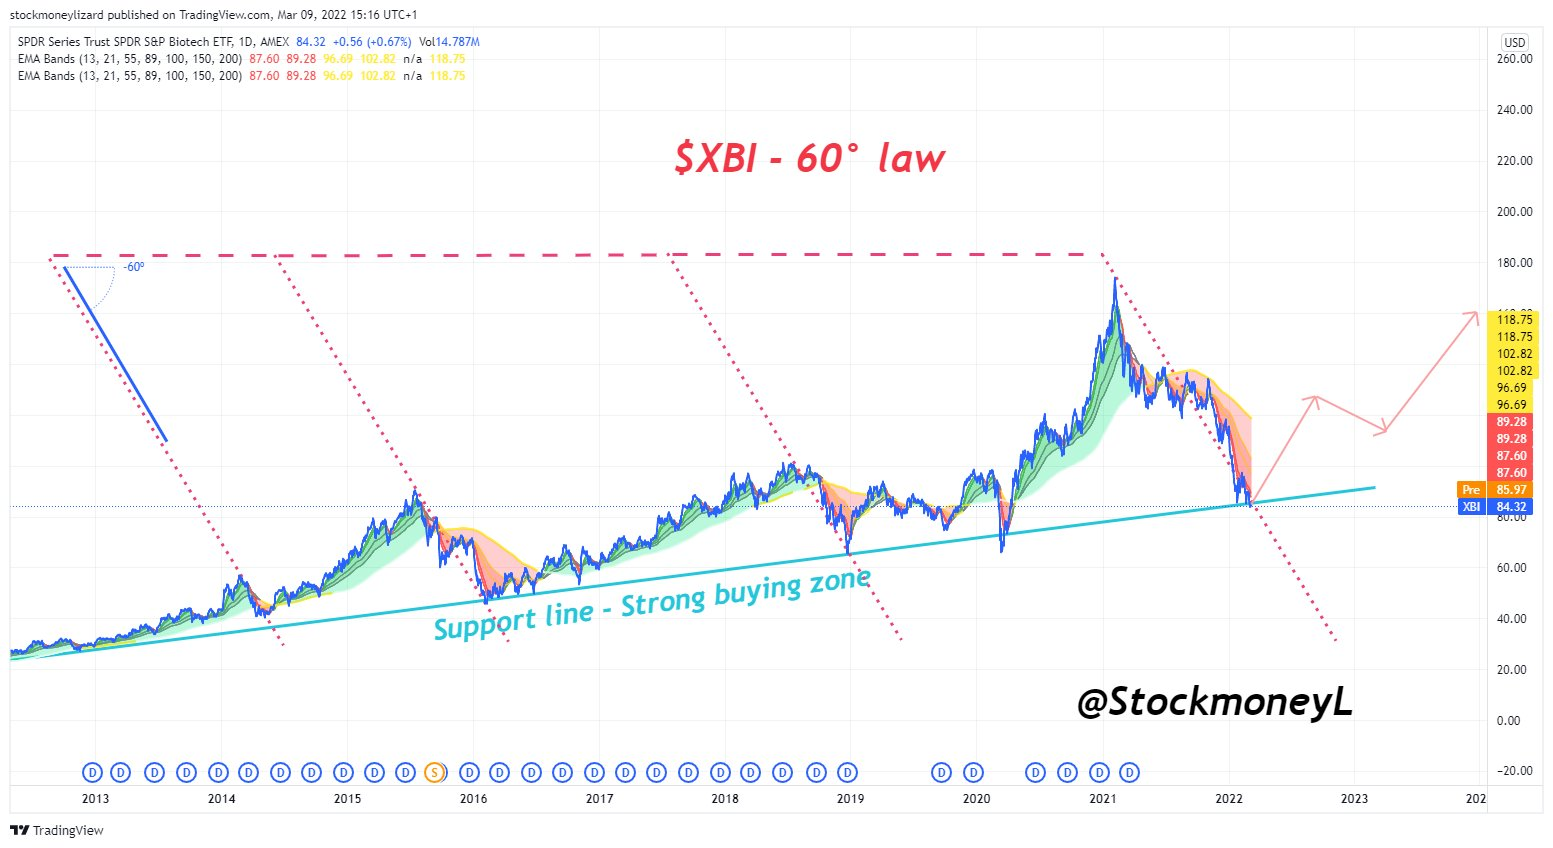
MINUS 60° law
(Stockmoney Lizard Pattern - long term outlook)
Many have been complaining that the $XBI dropping and dropping and that it was irrational and unpredicted. Of course, from a fundamental point of view, the sector is healthier than ever and there are so many good companies whose valuations we consider as severely undervalued. But these valuations create good buying opportunities. Nonetheless, as opposed to others, we believe that the current drop is somewhat expected. During the Corona pandemic, there was a steep increase in $XBI price. At some point, the whole sector became overhyped, resulting in numerous, high-valued IPOs, copycat biotechs that wanted to get their share from the Covid cake (good examples are $TNXP, $HTBX, $ABIO and many more). This being said, it’s clear that some sort of major correction was needed after the hype. Although often only a reason for a bear market is wanted than that there are fundamental reasons. In the past, the turning point has always been the crossing of the support line and a line that is drawn 60° from the top. This is where the $XBI currently ranges.
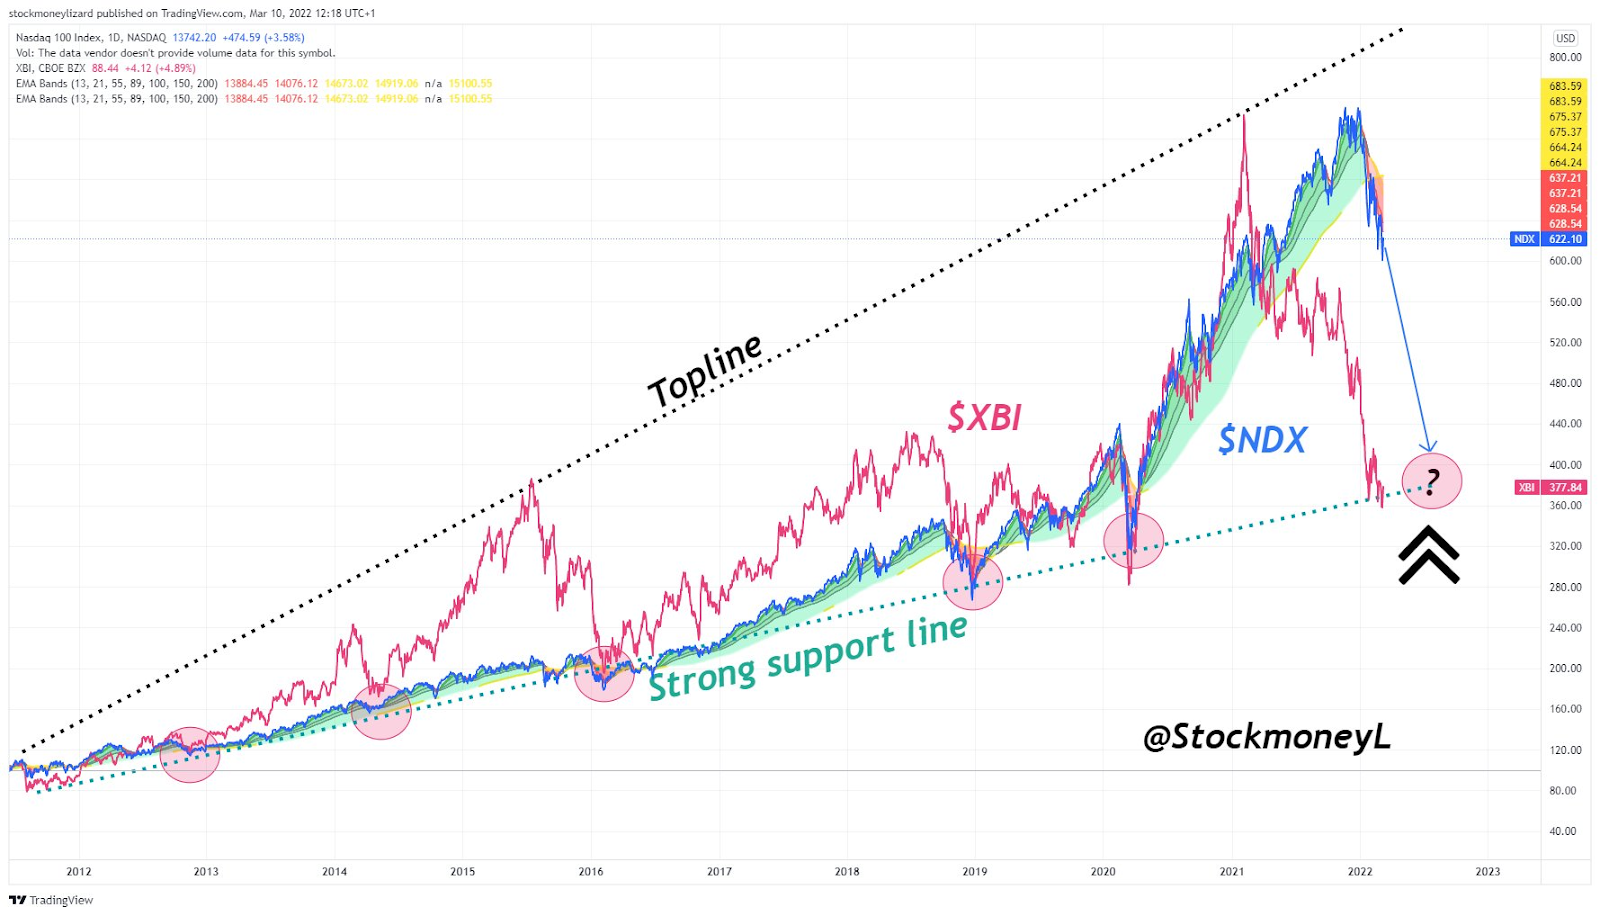
A second interesting chart is the comparison of the Nasdaq 100 tech index ($NDX) and the $XBI. From a macro point of view, both indices are growing at the same pace. Interestingly, the biotech sector had times where it was growing much faster - only to get drawn back harder. This interesting phenomenon creates points where $XBI and $NDX cross (or are about to cross) meaning that the ultimate growth is always the same for both indices. Currently, the $NDX ranges much higher than the $XBI. We believe that another crossing point is imminent. $XBI has already made it’s downmove. We believe that the $NDX downmove is yet to come which is why we are bullish on $XBI and bearish on $NDX.
Disclaimer
We may have beneficial long & short positions in the shares of the stocks presented here. It expresses our own opinions regarding trades. It’s no investment advice. We are not receiving compensation for it. We have no business relationship with any company whose stock is mentioned here.
Member discussion