C.R.E.A.M. #31 - Bitcoin breaks 63k in record speed - what's next? (FREE ISSUE)

Dear Lizards,
Bitcoin has once again proven its penchant for defying expectations. While many anticipated a dip following the much-awaited ETF approval, Bitcoin had other plans, surging over 50% in the subsequent four weeks. It's a classic case of Bitcoin doing the unexpected.
This surge marks a significant milestone for Bitcoin, as it finally forged its first real monthly "god candle," indicating a strong bullish sentiment and potential for further gains.
In this issue, we'll delve into what this milestone means for Bitcoin and what we can expect in the near future. Additionally, for our premium subscribers, we have an exciting update in store. We're preparing our next issue, which will include coverage of two new and ultra-hot altcoin projects with potential for over 20x returns. This follows our recent success with THETA, a coin in our portfolio that delivered a peak profit of 175% to our readers.
Stay tuned!
Yours,
Stockmoney Lizards
Who / what's behind the surge?
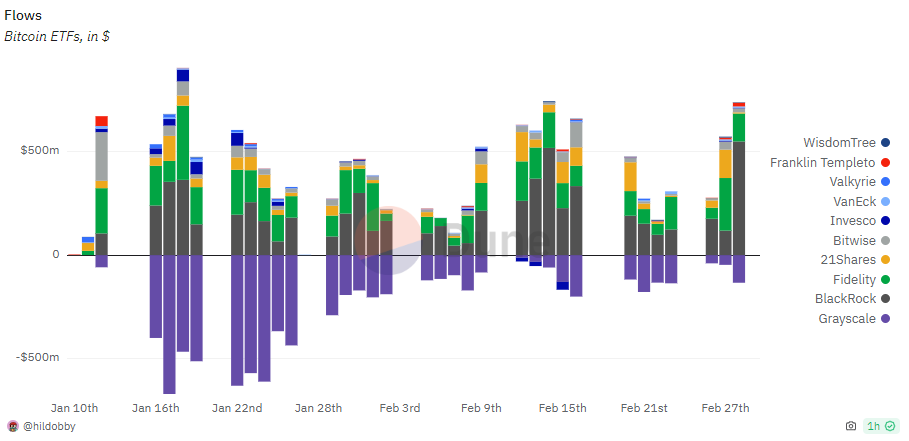
Most importantly: ETFs dominate the game, as expected! Regarding all Bitcoin ETFs collectively, the purchasing power has surpassed expectations, demonstrating remarkable figures. To illustrate, there has been an inflow of $6.87 billion since their inception, and currently, ETFs hold approximately 3.85% of the total Bitcoin supply!!! These figures are considerable, especially considering the relatively brief period in which they have been amassed.

The key player (also as expected): The rapid surge in BlackRock's Spot Bitcoin ETF (IBIT), which has now surpassed $10 billion in assets (BTC) and achieved the distinction of being the quickest ETF to achieve such a milestone, is grounded in a nuanced background.

In terms of the investor base, there's a consistent trend of notable buying orders from institutional players, contrasted with relatively smaller purchases from retail investors who appear to be taking a more cautious approach. This dynamic suggests that large investors, often referred to as "whales," are actively accumulating positions. Such behavior further supports the theory of a price surge, possibly instigated by the ETF's activity.

Bitcoin near its All time high
Technical Analysis and Outlook
Bitcoin's recent movements have brought it closer to its all-time high (ATH) of ~$68,000, prompting a careful examination of its trajectory. The 2-day chart highlights two parallel channels, delineating significant resistance and support levels at $67,000 and $47,000, respectively.

Traversing between $61,000 and $63,000, Bitcoin's resilience is evident amidst challenges reminiscent of its Q1 2021 peak. The recent surge post ETF approval, resulted in a notable 50% increase over four weeks before encountering a corrective phase! This is an impressive short-term performance!

Two months to Halving - where does the money flow from here?

Bitcoin is reaching resistance below the all time high. What does it mean for the price action?
For this, we take a look at the bigger picture: We see 3 different cycles - Halving is about 56 days away (orange rectangle).
In this process, we can see BTC is usually moving horizontally (sideways) - this would mean we could target a range between 49-65k.
When will BTC reach a new All time high?

Striking fact: The current price action is cyclically similar to the 2015-2016 period. These periods can be divided into 4 separate parts by processing these periods on the chart.
According to this system: We should be in the 4th part now --> Means: the next All time high is close. The dollar index is likely to be in a downtrend in the long term, while Bitcoin will rise aggressively from the 3rd quarter of 2024.
Monthly chart tells us: We are entering the parabolic phase!

The exciting thing is: We see that logarithmic MACD is moving in a positive direction towards green (black arrows). We tested the old highest (ATH) zone in the monthly candle. When we throw it above the middle line of the bollinger band, we can see that it has entered the bull period.
For the nerds :) - M1 Money indicates we go parabolic

The BTCUSD/WM1NS ratio is a ratio that shows the value of BTC relative to the m1 money supply.
"The money stock is the value of the total money circulating throughout the economy over a given time period. The money supply is measured by 2 instruments called M1 and M2. M1 is the sum of cash, demand deposits and checks in the economy. M2 is the sum of M1 plus savings and short-term time deposits."
BTCUSD/NASDAQ 1w 3Rd Breakout 3rd Bull-Season !

3rd Breakout 3rd Bull-Season! In the past, when BTC price was at this point, we have now entered a period of aggressive action!
- Bitcoin broke up the triangle.
- Bitcoin broke the keltner channel up.
- Completely left the level 2 zone behind.
Thanks for reading C.R.E.A.M.
Subscribe to receive new posts and support our work.
Disclaimer:
We may have beneficial long & short positions in the shares of the stocks presented here. We are long in Bitcoin. The posts here express our own opinions regarding trades. It’s no investment advice. We are not receiving compensation for it. We have no business relationship with any company whose stock is mentioned here. All stock chart and prediction models are our own work and we believe they may help to better understand future price movements, however, those are just models which may be influenced by external factors and may not become true. Investing in the stocks and coins presented here is risky and may and in a complete loss of fortune.
Member discussion