C.R.E.A.M. #17 - Meltdown! Is my altcoin portfolio going to waste? (FREE ISSUE!!)

Editorial
Dear Lizards,
In the midst of a summer correction, the crypto market faces challenges as Bitcoin plunges below $29k, and altcoins witness a $3.5 B market cap decline in the last 24 hours.
The SEC's request for Coinbase to delist all coins except Bitcoin raises concerns about the future of altcoins. What lies ahead for the crypto space? Is this the end for altcoins?
Our experts delve into the implications and potential outcomes in this uncertain landscape. Stay informed to make well-informed decisions.
What you'll find in this issue:
- The SEC and Coinbase - what are the implications
- Altcoins market cap roundup and outlook
- Ethereum Analysis
Yours, Stockmoney Lizards
Disclaimer:
This article is for informational purposes only and should not be considered as financial advice. We may have long- or short positions in the cryptocurrencies discussed here and we are willing to close these position with benefit on short-notice depending on current market conditions. Cryptocurrency markets are highly volatile, and trading involves risks. Investors should conduct their own research and seek professional advice before making any investment decisions.
SEC's Request to Delist Cryptocurrencies
Spurs Coinbase to Legal Battle
The U.S. Securities and Exchange Commission (SEC) reportedly urged Coinbase, the cryptocurrency platform, to cease trading in all cryptocurrencies except bitcoin before taking legal action against the company in June. According to CEO Brian Armstrong, the SEC's request presented a challenging situation for Coinbase, potentially spelling the end of the crypto industry in the U.S. if complied with. Consequently, Coinbase opted to contest the matter in court to seek clarity on the issue.
The SEC's lawsuit against Coinbase accused the platform of illegal operations due to its failure to register as an exchange. Additionally, the commission alleged that Coinbase traded at least 13 crypto assets classified as securities that should have been registered, including tokens like Solana, Cardano, and Polygon.
However, a Coinbase spokesperson disputed the notion that the SEC had deemed all assets, except bitcoin, as securities. They clarified that formal requests require a vote from the full commission, and such a request was never made by the SEC.
The SEC's actions are part of Chair Gary Gensler's initiative to establish regulatory control over the crypto industry, which he has referred to as a "Wild West" undermining investor trust in U.S. capital markets. The ongoing legal disputes between regulators and crypto companies underscore the need for transparent and fair rulemaking to foster growth in the U.S. cryptoeconomy.
While the situation remains uncertain, Coinbase continues to engage in discussions with the SEC, advocating for regulatory clarity and congressional action to create a conducive environment for American crypto users and industry players.
As the crypto industry seeks to navigate the evolving regulatory landscape, market participants will closely monitor the outcomes of these legal battles, which could significantly impact the future of cryptocurrencies in the U.S.
Quo vadis, Altcoins?
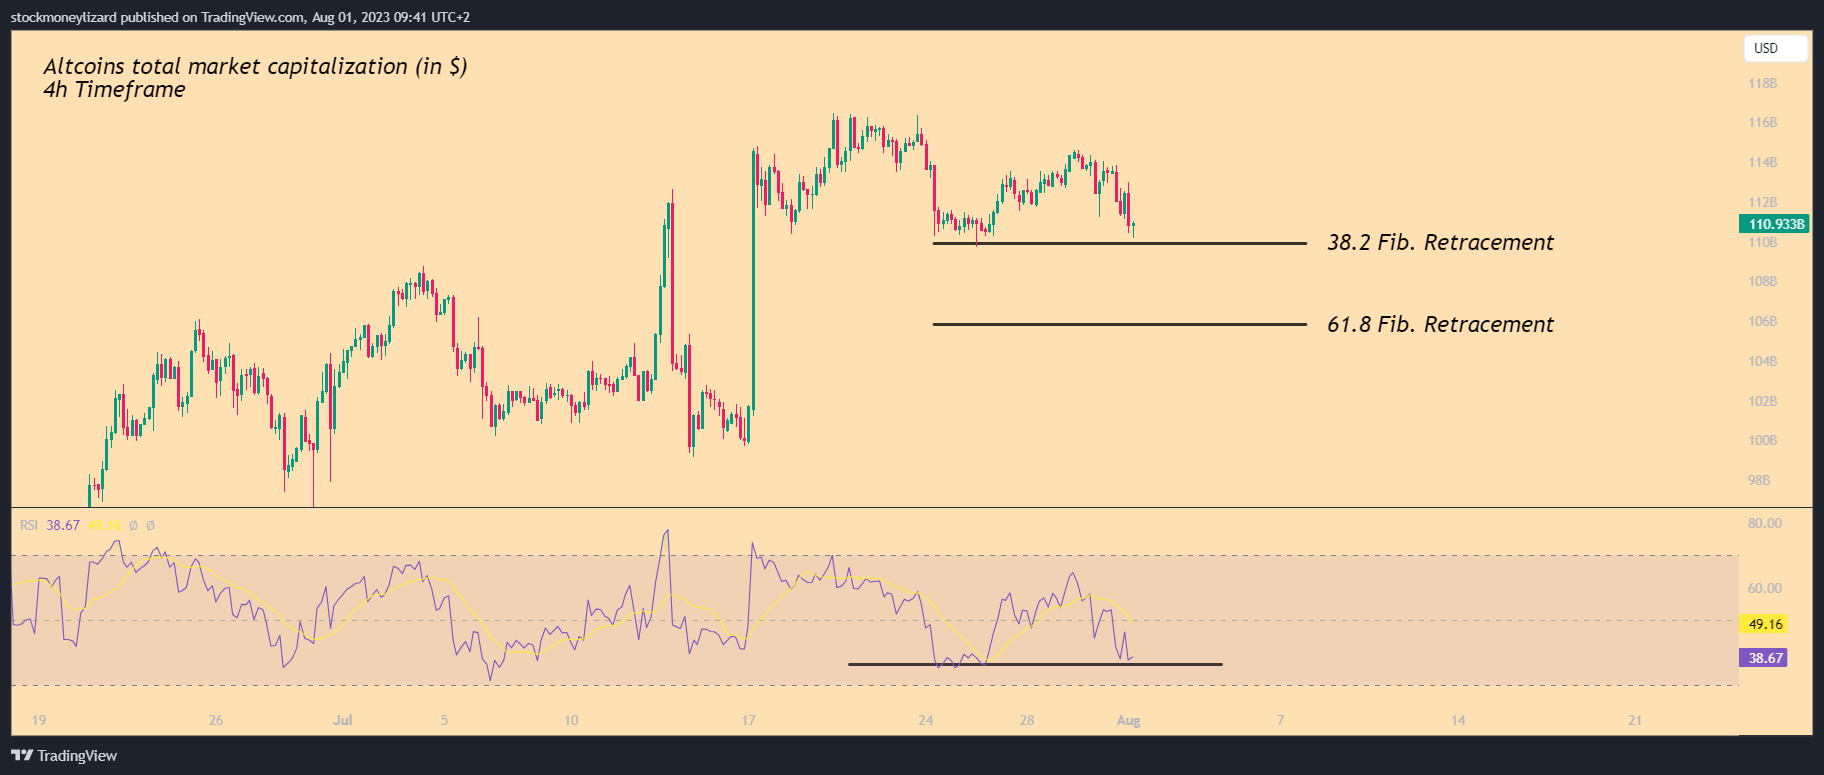
Altcoins encountered a significant selloff in the past 24 hours, causing a substantial reduction of $3.6 billion in their total market capitalization. Nevertheless, on closer examination of the 4-hour chart, these alternative cryptocurrencies found support at a previous level, which intriguingly coincides with the 38.2% Fibonacci retracement level of the recent uptrend. This convergence provides traders with valuable insights, as Fibonacci retracements are technical tools derived from the Fibonacci sequence that can identify potential support and resistance levels, aiding in their trading decisions.
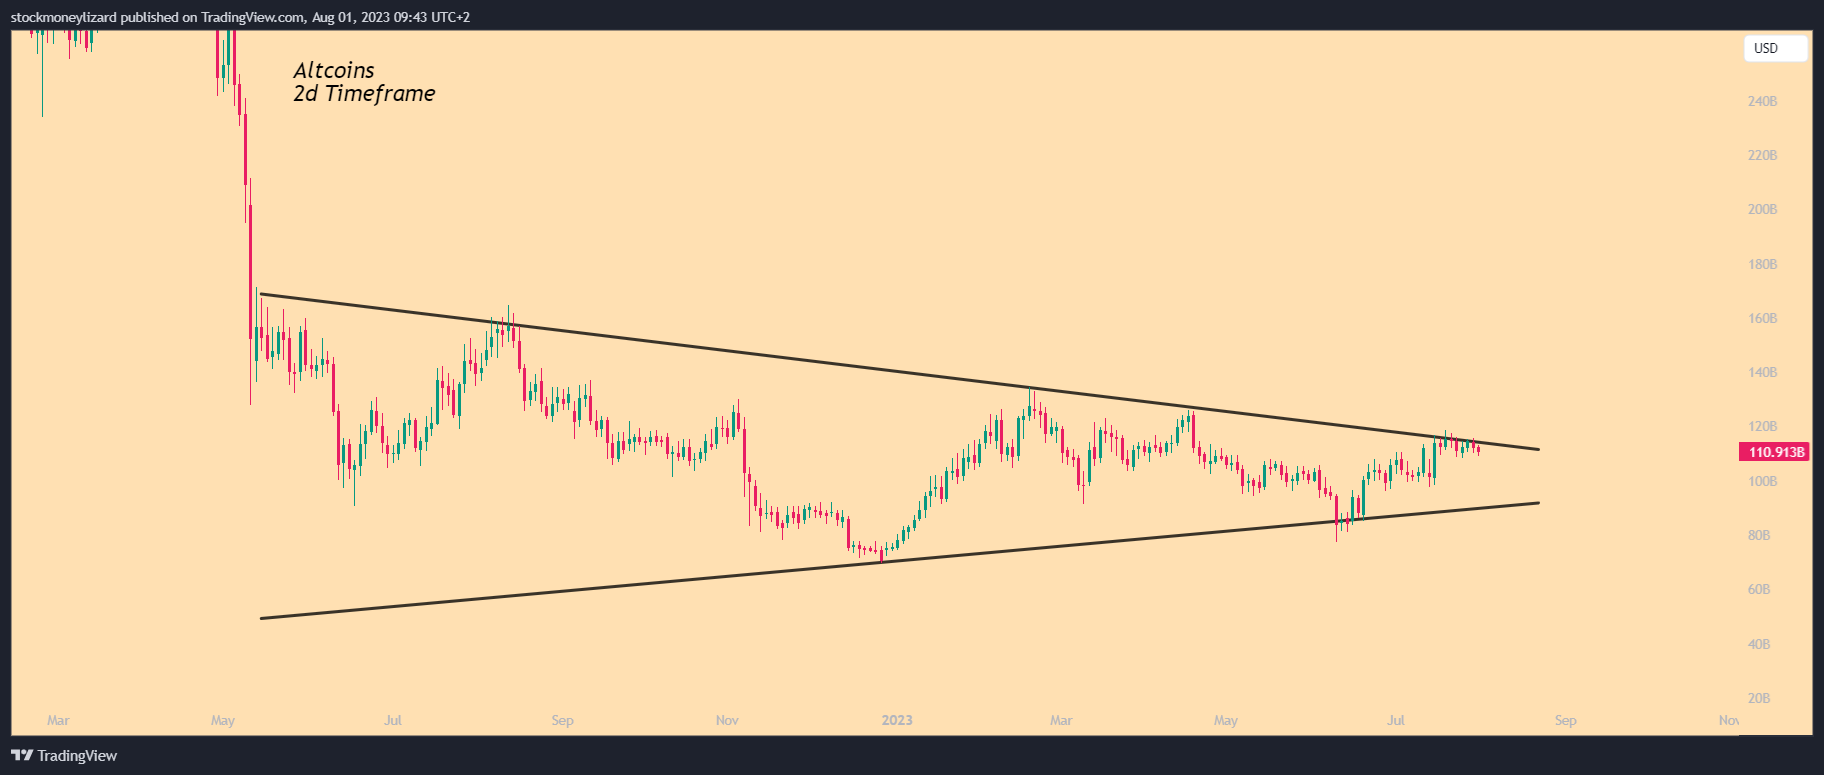
As we zoom out to the 2-day chart, an intriguing symmetrical triangle formation emerges, with the current market cap hovering around the upper resistance line of this pattern. Symmetrical triangles are renowned for their ambiguity, holding the potential for both bullish and bearish breakouts. While approaching the downtrendline appears theoretically plausible, our outlook anticipates a minor correction during the summer months, leading to sideways movements for altcoins. The prospect of a potential rejection at the upper line of the triangle looms ahead.
Excursus: Symmetrical Triangles
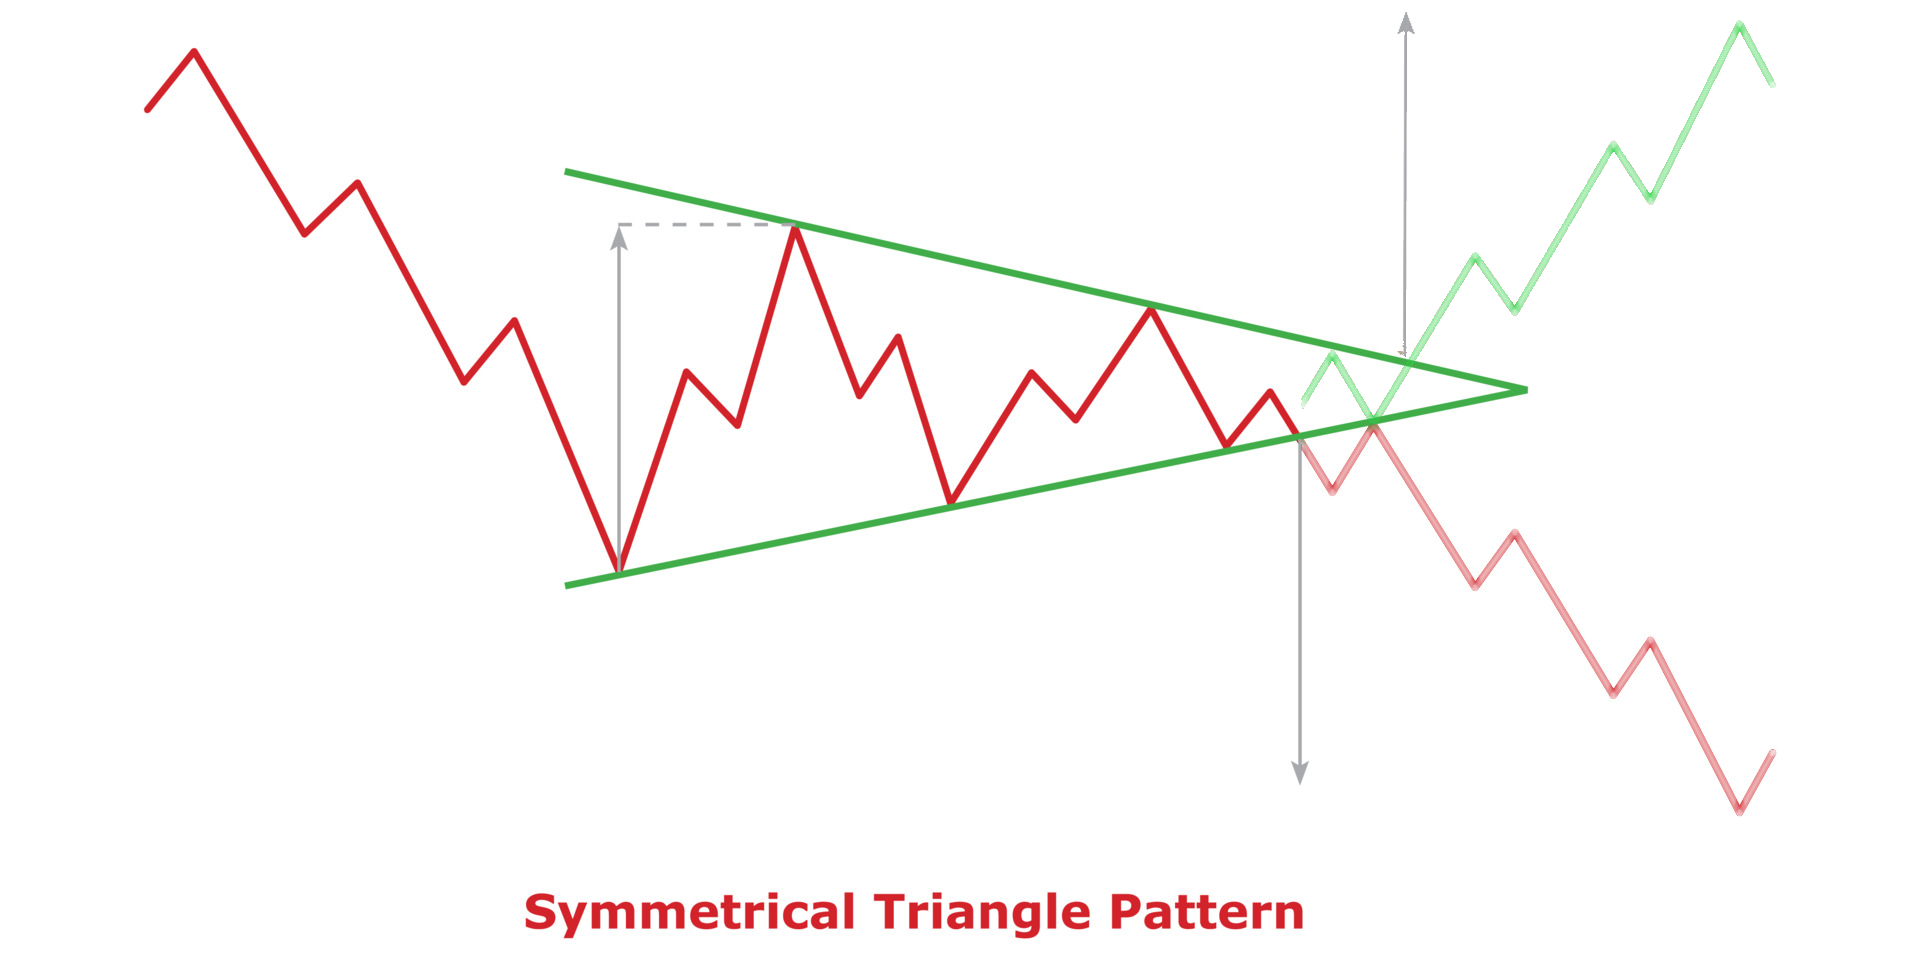
Symmetrical triangles are prominent chart patterns commonly observed in technical analysis. Traders closely monitor these formations as they often signal potential price breakouts in the underlying asset. As the name suggests, symmetrical triangles exhibit a symmetrical shape, with converging trendlines forming higher lows and lower highs.
Bullish and Bearish Breakout Potential: Symmetrical triangles can lead to both bullish and bearish breakouts. A bullish breakout occurs when the price breaks above the upper trendline, indicating a potential upward trend continuation. On the other hand, a bearish breakout happens when the price breaks below the lower trendline, suggesting a possible downward trend continuation.
Trading the Symmetrical Triangle: Traders often enter a position in anticipation of the breakout, although it's essential to wait for the confirmation of the breakout before executing a trade. This confirmation is typically provided when the price decisively closes above or below the trendline.
Targets and Stop-Loss Levels: To set profit targets, traders can measure the height of the triangle pattern at its widest point and project it in the direction of the breakout. This projection can provide an estimate of the potential price move after the breakout. However, it's essential to be flexible and adjust targets based on market conditions and price action.
For managing risk, placing a stop-loss order slightly below the trendline for a long trade or slightly above the trendline for a short trade can help protect against adverse price movements.
Conclusion: Symmetrical triangles are valuable tools in a trader's arsenal, providing insights into potential price breakouts. Whether bullish or bearish, these patterns can present lucrative trading opportunities for those who analyze them correctly. However, as with all technical patterns, it's crucial to combine them with other indicators and perform thorough analysis to enhance the probability of successful trades.
Ethereum Update
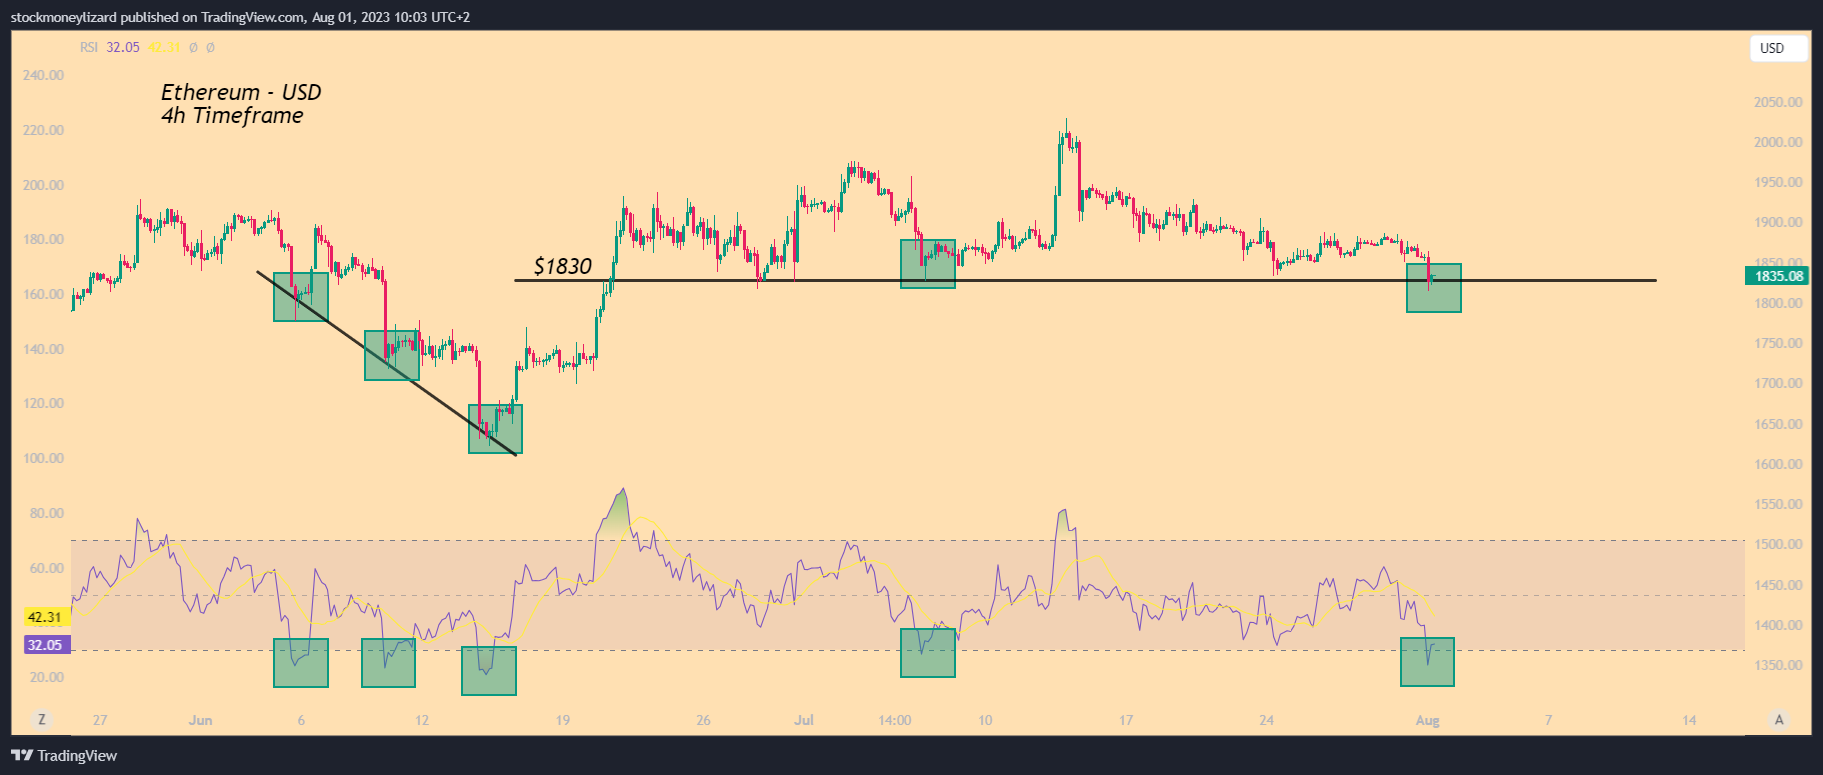
In the 4-hour chart of Ethereum, the cryptocurrency has displayed a noteworthy recovery as it found support around the $1830 mark. Concurrently, the 4-hour Relative Strength Index (RSI) dropped to the oversold zone, which historically has been indicative of short-term sideways recoveries or even potential rebounds. These past instances, highlighted as green boxes on the chart, suggest the possibility of a temporary recovery in the near term. However, it's important to exercise caution, as the ongoing recovery might only be a brief respite, signaling that the correction could endure for a more extended period.
Taking a closer look at Ethereum's daily chart, we observe the emergence of a possible head and shoulders pattern. Although not as distinct as the head and shoulders pattern seen between March and June 2023, the current formation could still hold significance as a potential bearish signal. This alignment with the overall correction mode prevalent in the altcoin market adds weight to the possibility of a downside movement.
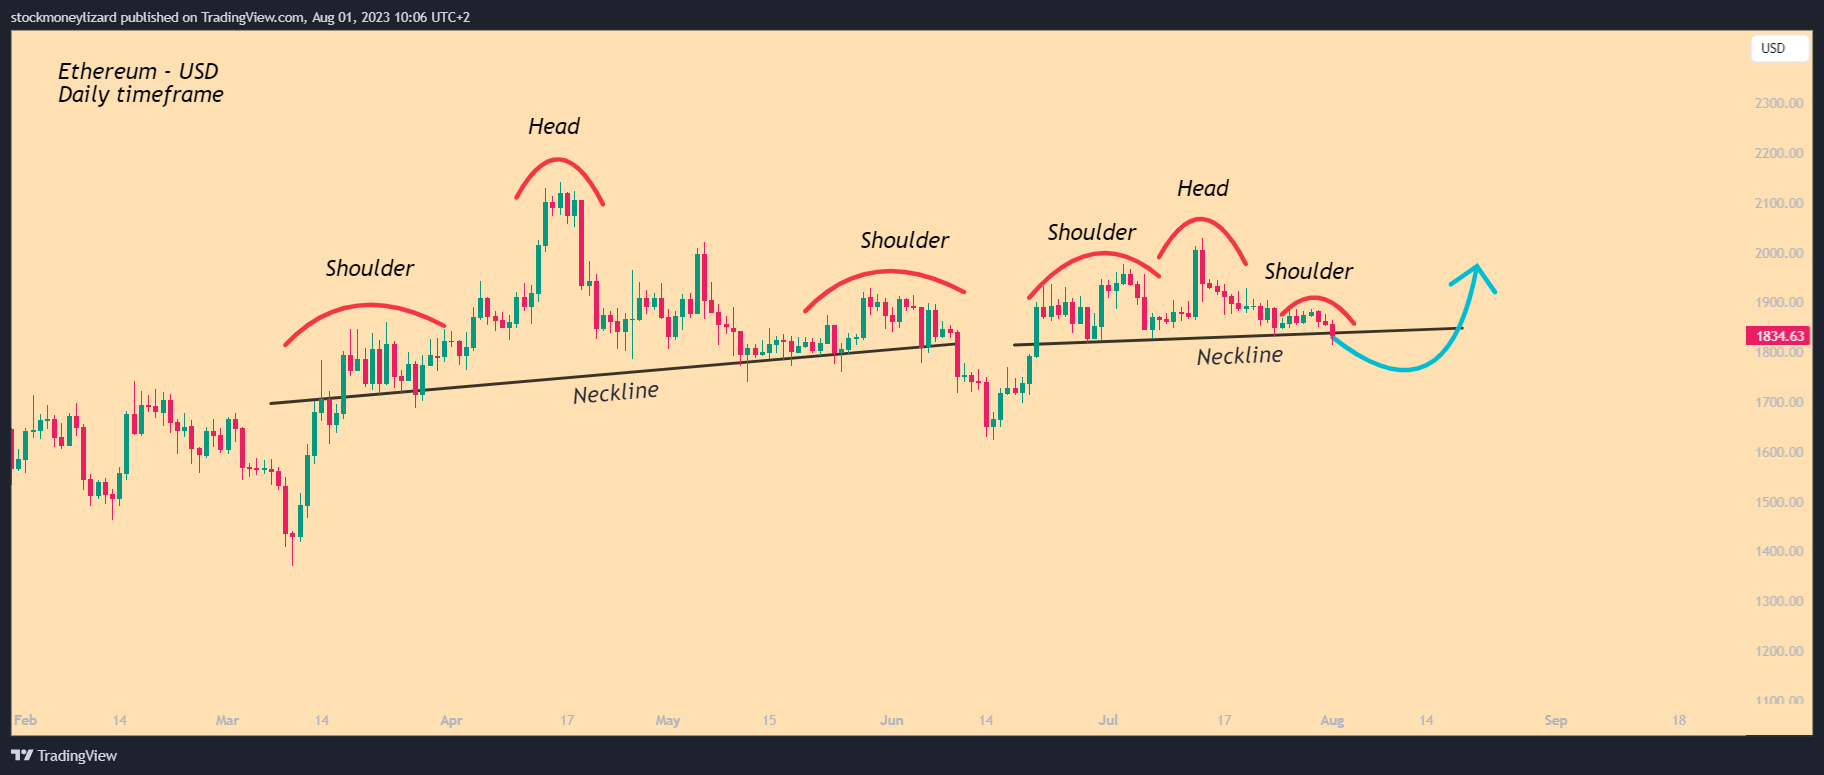
As traders and investors navigate this complex landscape, being mindful of both the short-term dynamics and the broader market trends becomes crucial. While the 4-hour chart hints at a potential short-term rebound, the presence of the head and shoulders pattern on the daily chart signals a more cautious approach. The combination of these patterns indicates that the market might witness further fluctuations before a definitive direction is established.
Excursus: Head and Shoulders Pattern
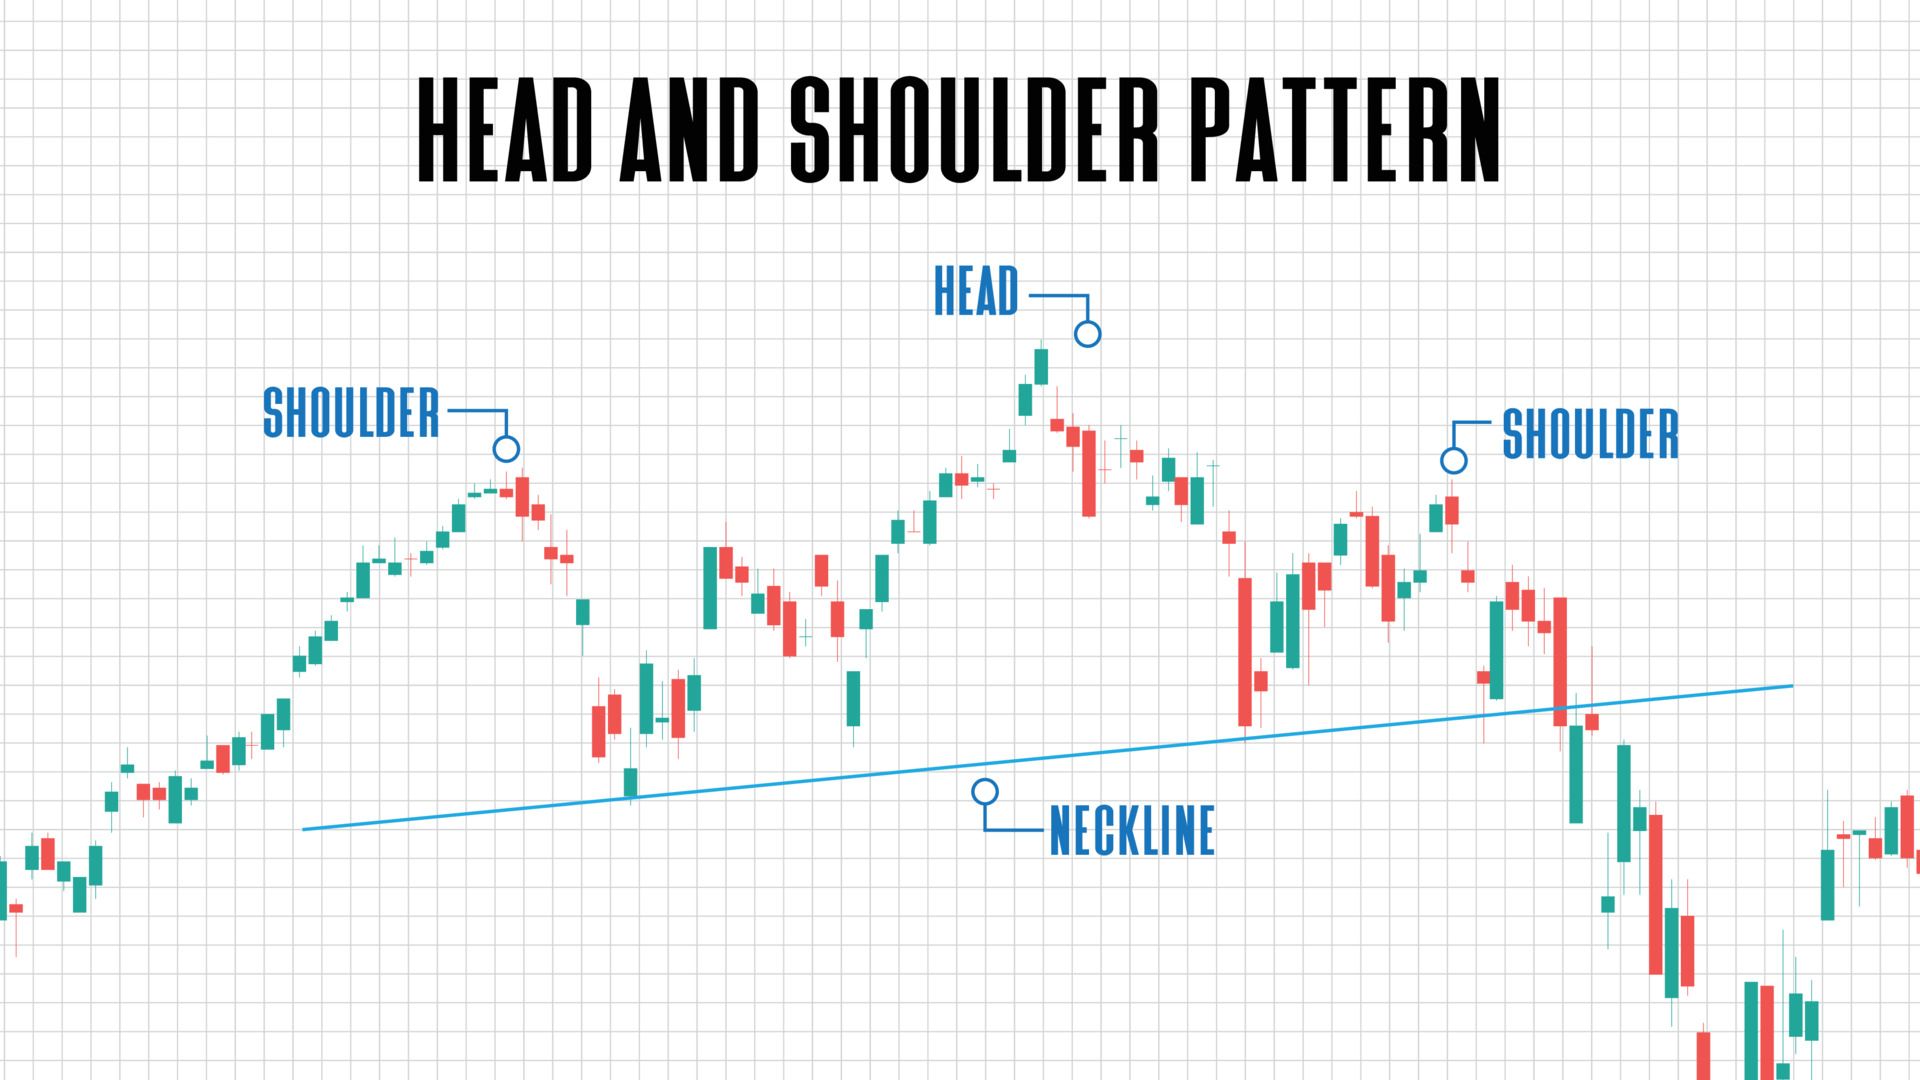
The head and shoulders pattern is a significant chart formation used in technical analysis to predict trend reversals. It consists of three distinctive peaks, with the middle peak (the head) being higher than the two surrounding peaks (the shoulders). The pattern suggests a shift from a bullish trend to a bearish one.
Trading the head and shoulders pattern typically involves entering a short position when the price breaks below the neckline, which is a support level connecting the two shoulders. Traders often set their stop-loss just above the right shoulder, while the profit target is calculated by measuring the distance from the head to the neckline and projecting it downwards from the neckline breakout point.
It is important to wait for the pattern's confirmation before taking action, as false signals can occur. Additionally, combining the head and shoulders pattern with other technical indicators and chart patterns can further enhance its reliability in making informed trading decisions.
Giveaway: 1 month premium plus for free
We are excited to announce our Discord premium trading channel with a stellar track record, providing timely updates on market conditions and lucrative trading opportunities to our valued members. Currently, we are running an exclusive giveaway, offering a 1-month premium membership valued at $80. To participate, simply share your most impressive, innovative, and captivating long-term Bitcoin chart in the comment section of the designated tweet.
🎉 #Giveaway Alert! 🎉
— Stockmoney Lizards (@StockmoneyL) July 31, 2023
🚀 Win a 1-month Discord Premium Plus membership worth $80! 🚀
Simply post your most beautiful, innovative, or sophisticated long-term #Bitcoin chart in the comments below.
The Stockmoney Lizards team will select the winner!
For details, see 👇👇 pic.twitter.com/CMdEcZ3m32
The Stockmoney Lizards team will select the winner. Even if you choose not to join our premium service, we highly recommend staying informed by joining our free Discord server. Your journey to staying ahead in the market starts here!
Thanks for reading C.R.E.A.M.
If you have any question, join our Discord trading server. You will get answers!
Member discussion