C.R.E.A.M. #1 - The rise of Bitcoin

Editorial
Welcome Lizards,
Bitcoin is expected to go to one million dollars in 90 days. Who is betting on this? Credit Suisse has been taken over by UBS, and the consequences of this are yet to be seen in the European region. Deutsche Bank is rumored to be the next in line, which could have significant financial implications. Furthermore, UBS is set to receive more money through swap lines both globally and in Europe. They are also considering more than 18 trillion US dollars in additional insurance, which could be a significant windfall. The FOMC meeting yesterday revealed a hike by 0.25%, while Elon Musk has called for a 0.5% interest rate cut. In this current issue, we will cover all these issues and we will also be sharing our personal Bitcoin price forecast and discuss the Coin of the Week and possible trading ideas. And of course you’ll get a meme.
In This Issue:
- Market situation
- Banking crisis
- Bitcoin short and long term outlook
- Trading strategy for Bitcoin
- Coin of the Week
Macroeconomic Situation
We will keep it short and stick to the most important points
We know you want to read about bitcoin here. You get inundated with FED, FOMC, interest rate hikes etc anyway. As we said, we'll keep it short. this takes 5 sentences and three charts and summarizes everything that is currently important for crypto and bitcoin.
Chart I - Interest rates and Inflation
Inflation can be fought with rising key interest rates, as Figure 1 shows. The negative side effect and its impact on the economy is shown below in chart 2.
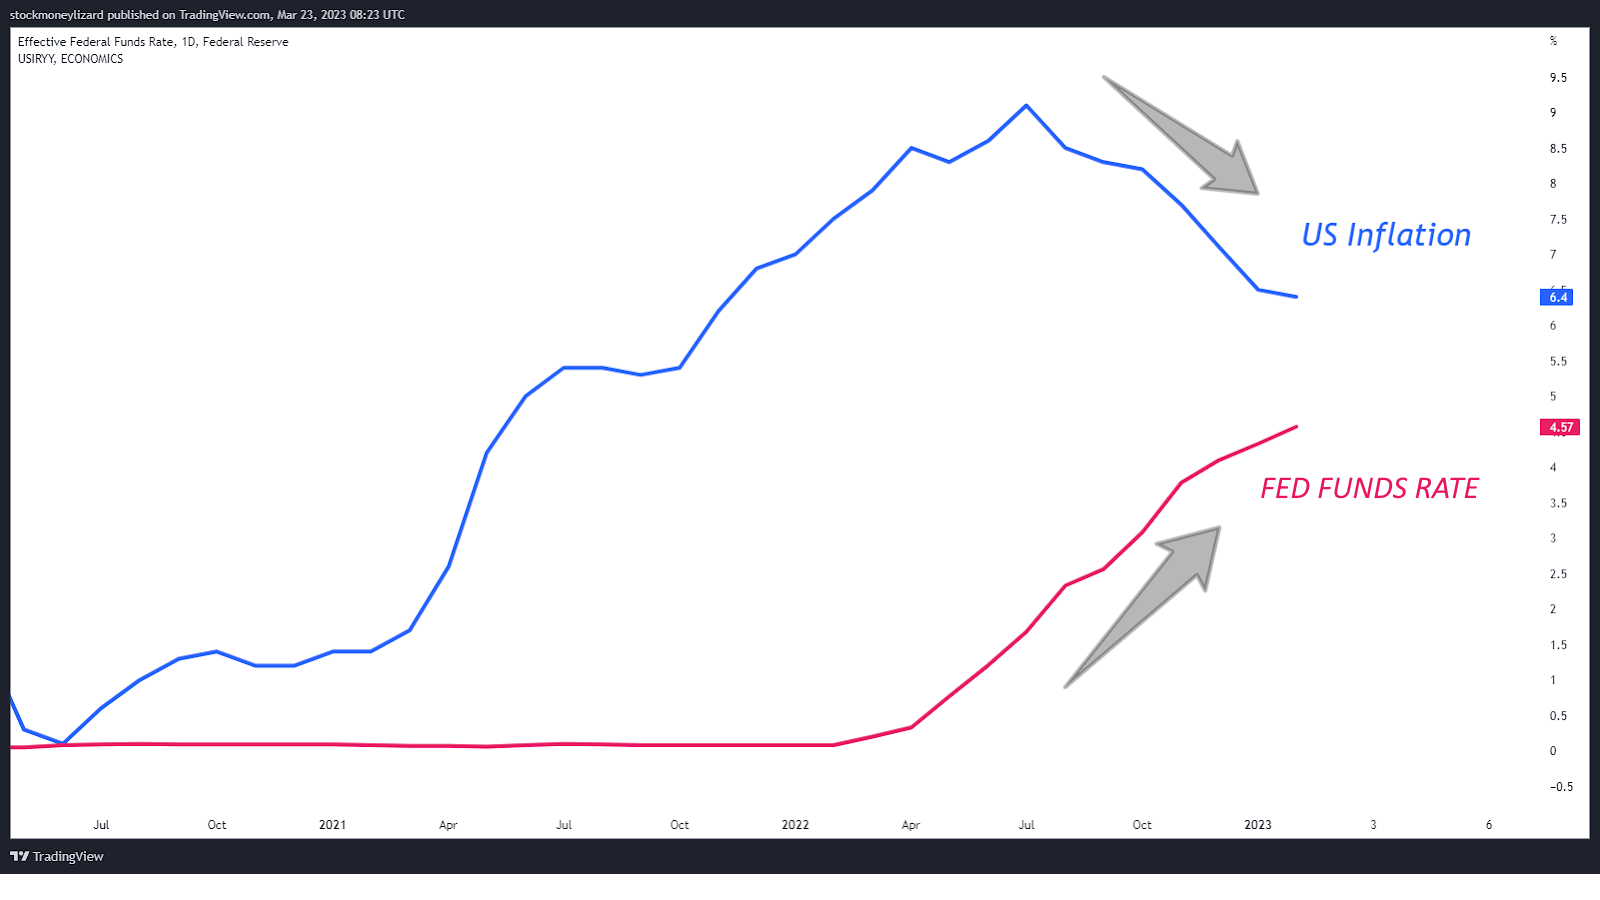
Chart II - High Interest rates fight inflation... and can f*kc banks and the economy
High interest rates can have a significant impact on the banking industry. When interest rates are high, borrowers may find it more challenging to repay their loans, which can lead to a higher rate of loan defaults. This, in turn, can create problems for banks, as they may have to write off bad loans, which can impact their profitability and solvency. Bitcoin is seen as an opponent to the classic fiat money system (represented by large banks). It is therefore only logical that bitcoin benefits from the banking crisis (Figure 2).
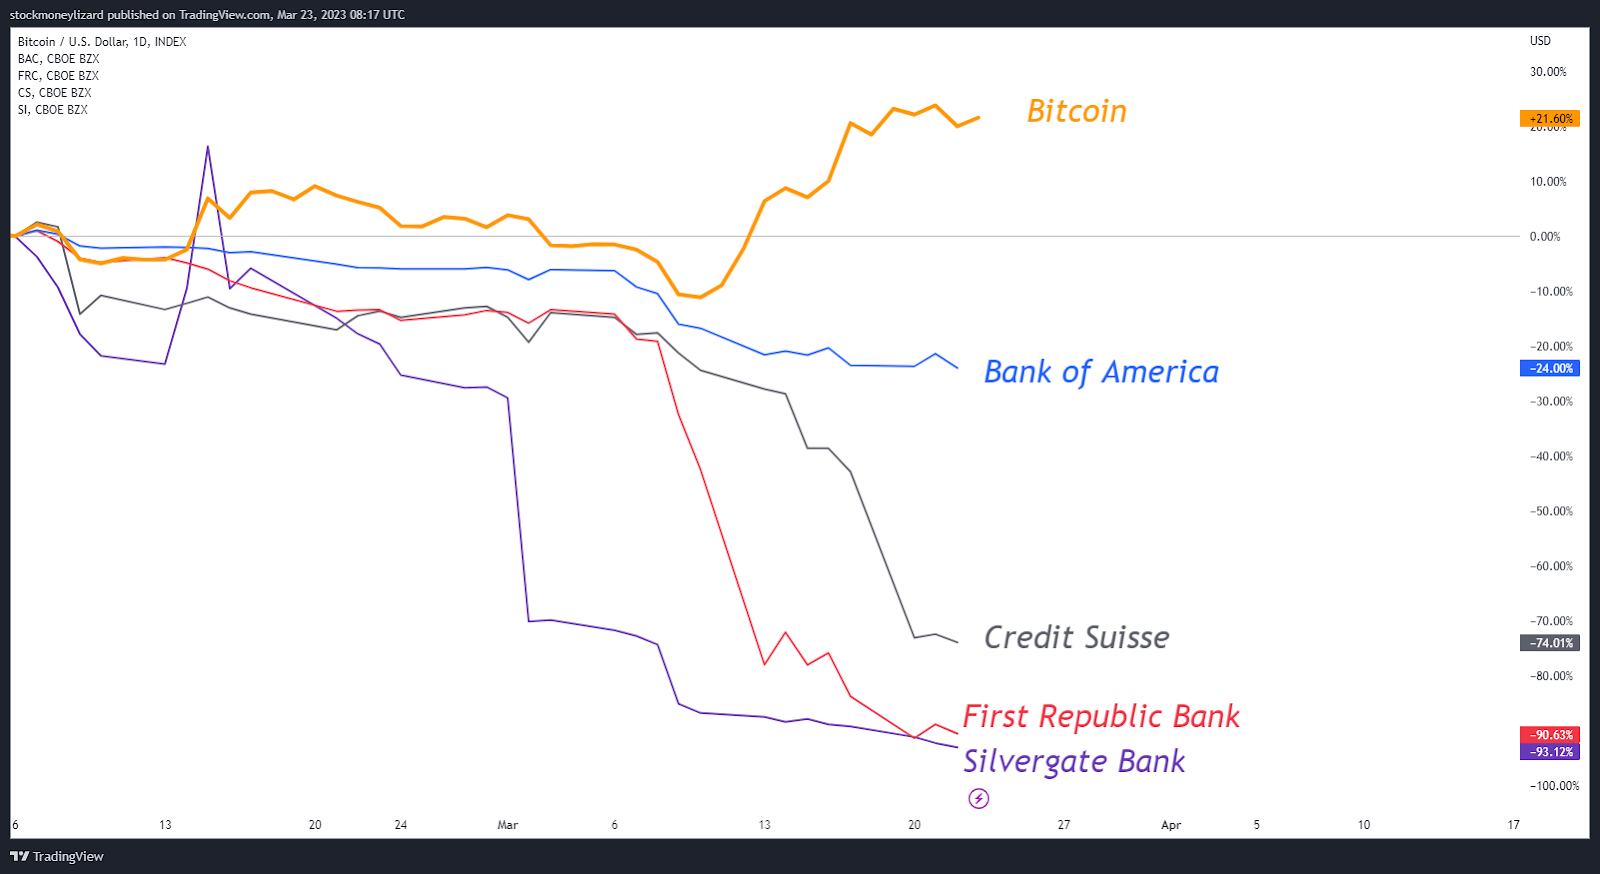
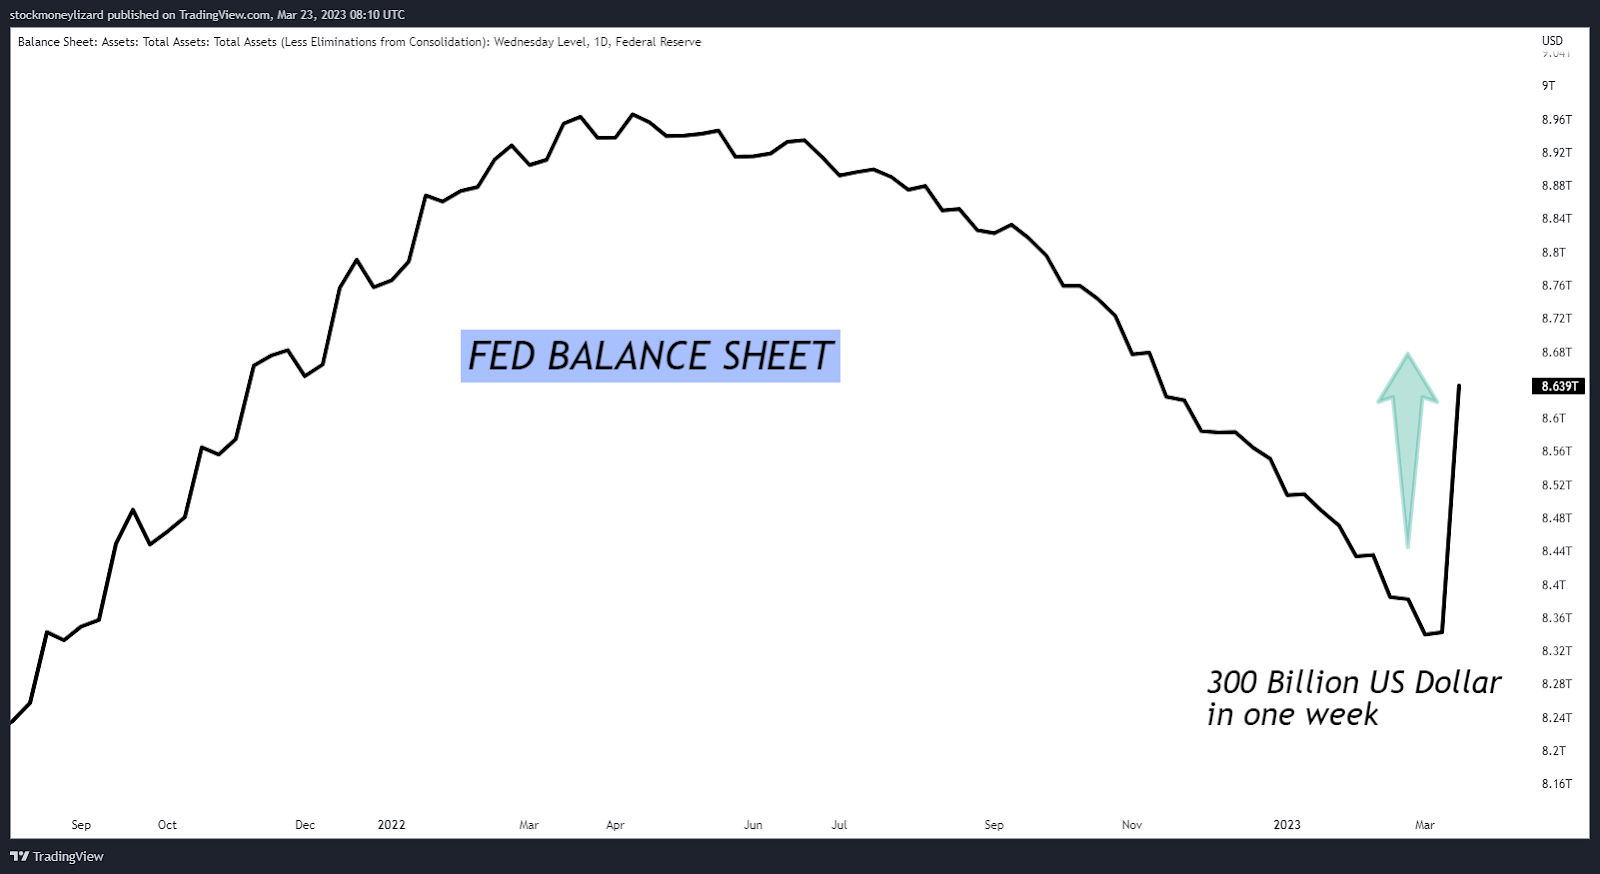
Chart III - How do you fight inflation and save banks at the same time? The inflation paradox.
The FED's tight interest rate policy has indirectly led to a banking crisis. Now the current economic crisis threatens to worsen. And how do you keep it from getting worse? By printing money (currently happening, Figure 3). And what does that lead to? inflation... A vicious circle.
So the Fed has to step on the gas and put the brakes on at the same time.
Bitcoin
What's happening now, in the near future and in the coming two years
Who was betting that Bitcoin hits $ 1 million USD within 90 days?
Balaji Srinivasan, the former CTO of Coinbase, has made a bold prediction that Bitcoin will reach $1 million by June 17 due to the rapid devaluation of the U.S. dollar. Srinivasan has entered into a $1 million bet via Twitter with two individuals, offering up Circle's USDC stablecoin if Bitcoin fails to achieve the historic gains he predicts. He believes that the global economy is on the brink of change, leading to what he calls "hyperbitcoinization," where Bitcoin becomes the dominant currency, replacing the traditional monetary system. This prediction comes as the U.S. financial market is experiencing uncertainty due to a series of bank failures. The recent surge of Bitcoin, surpassing $28,000, has led some to refer to it as "The Great Decoupling" . Srinivasan's bold bet has sparked a lively debate, with various experts and commentators weighing in on the feasibility of his prediction. In our opinion, this appears to be nothing more than a promotional stunt, with no significant underlying value or substance. We bet 5$ million against it😘
I will take that bet.
— Balaji (@balajis) March 17, 2023
You buy 1 BTC.
I will send $1M USD.
This is ~40:1 odds as 1 BTC is worth ~$26k.
The term is 90 days.
All we need is a mutually agreed custodian who will still be there to settle this in the event of digital dollar devaluation.
If someone knows how to do this… https://t.co/hhPr522PQu pic.twitter.com/6Aav9KeJpe
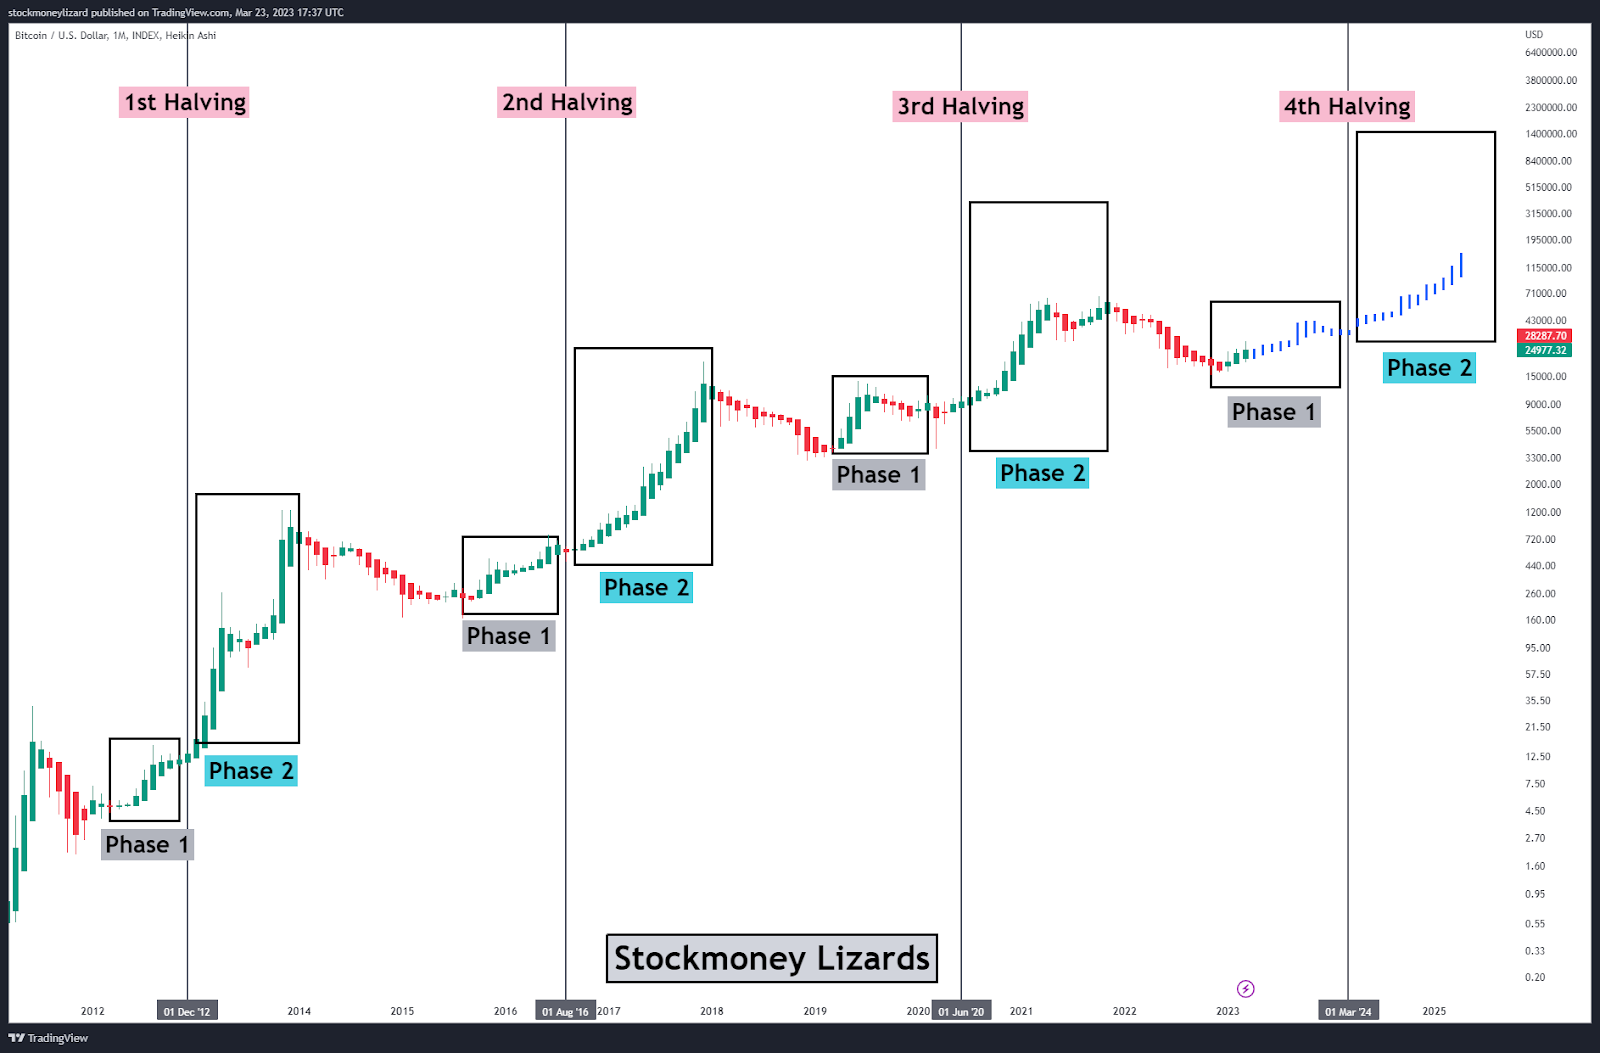
Macro chart - this is just the beginning
Each bitcoin cycle consists of a bear market, a consolidation period and a 2-phased bull market (Figure 4). The first phase of the bull run is moderate: upside 200 - 300 %. This covers the period after the consolidation and the pre-halving phase. After the halving, the scarcity leads to a fundamental revaluation and a strong increase of several hundred to thousand percent (Phase 2). We are currently in Phase 1.
Short-Term price prediction
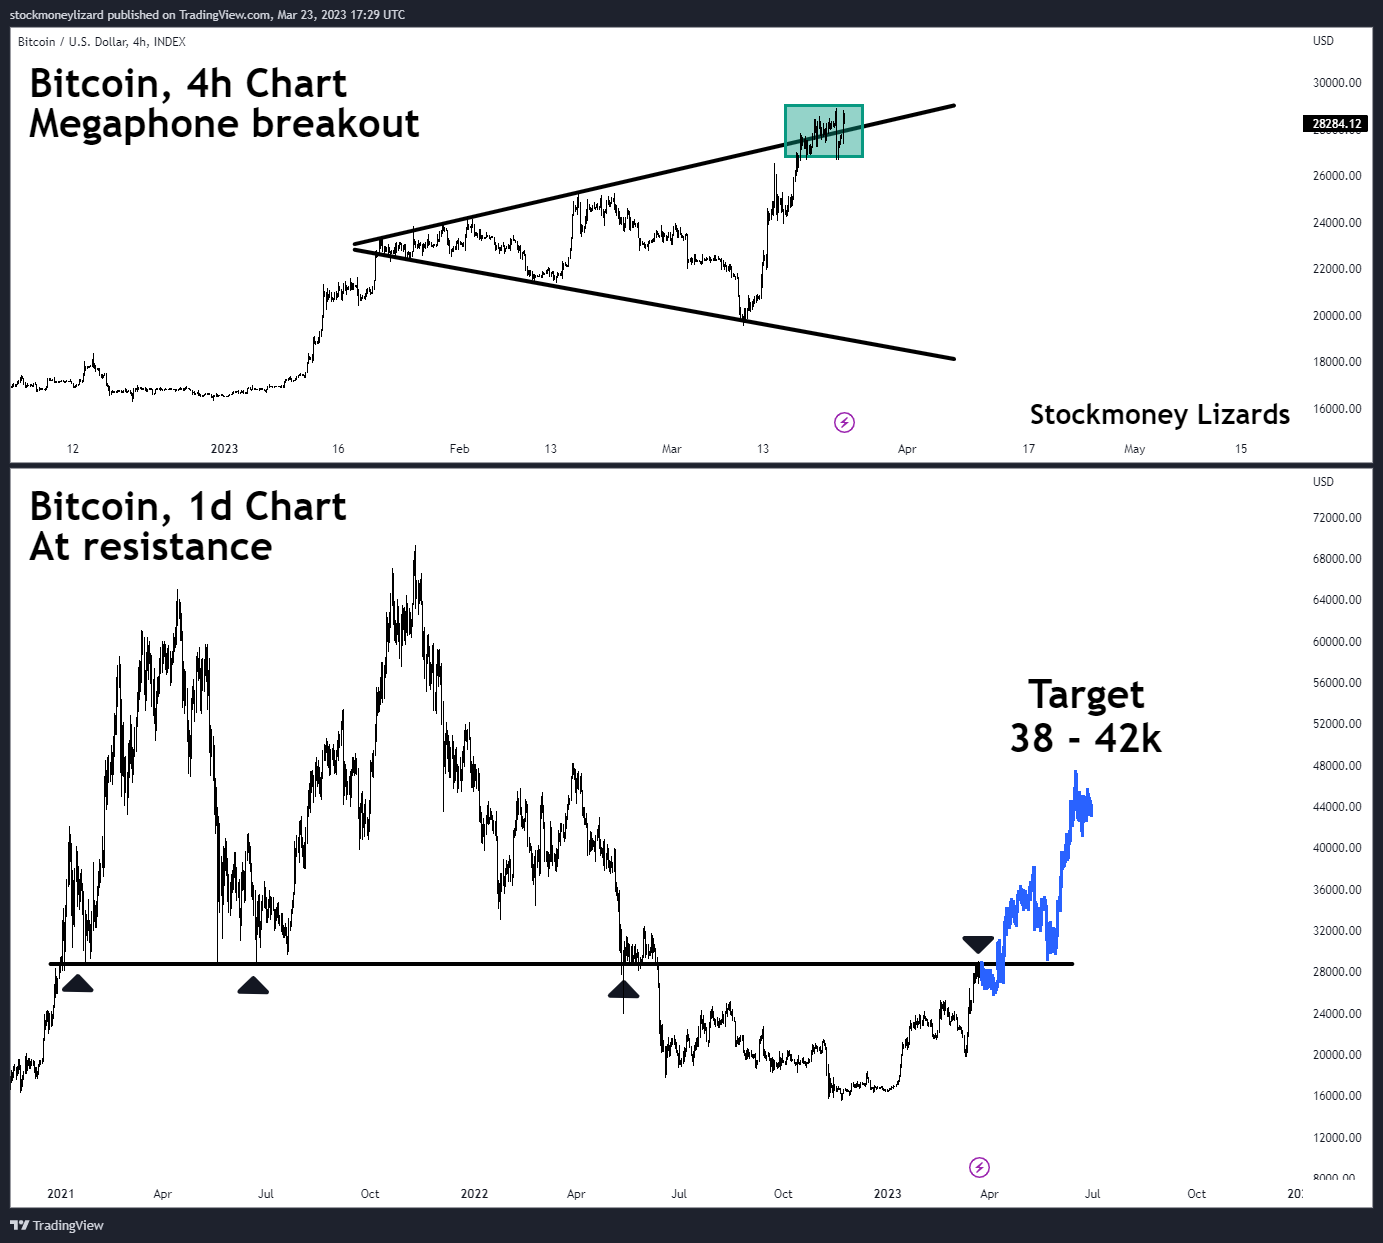
Ok, you have understood the phases. Much more important: what is currently happening? As you can see in Figure 5, Bitcoin has broken out of the bullish megaphone pattern and is now moving up along the upper trendline. We expect a short period of consolidation, with the 28k line playing an important role as resistance (see lower image in Figure 5). Pullbacks between 26 and 28k can occur here. If the 28.8k resistance is broken, then the 30k mark should fall within the next few weeks. In any case, there is enough fuel in the tank. We see a preliminary target for this Phase 1 between 38k and 42k.
Bitcoin long-term strategy BHS
(BUY -HODL - SELL)
Everyone has their own investment strategy. And when in doubt, Bitcoin HODL is the easiest method and certainly a good choice. We will continue to discuss diversification, exit/entry points, trading, etc. in the following issues.
Here we want to show you a method how to optimize the profit margin with Bitcoin as a long term investment in contrast to the normal HODL. The Bitcoin chart is very predictable, as you can see in Figure 6...
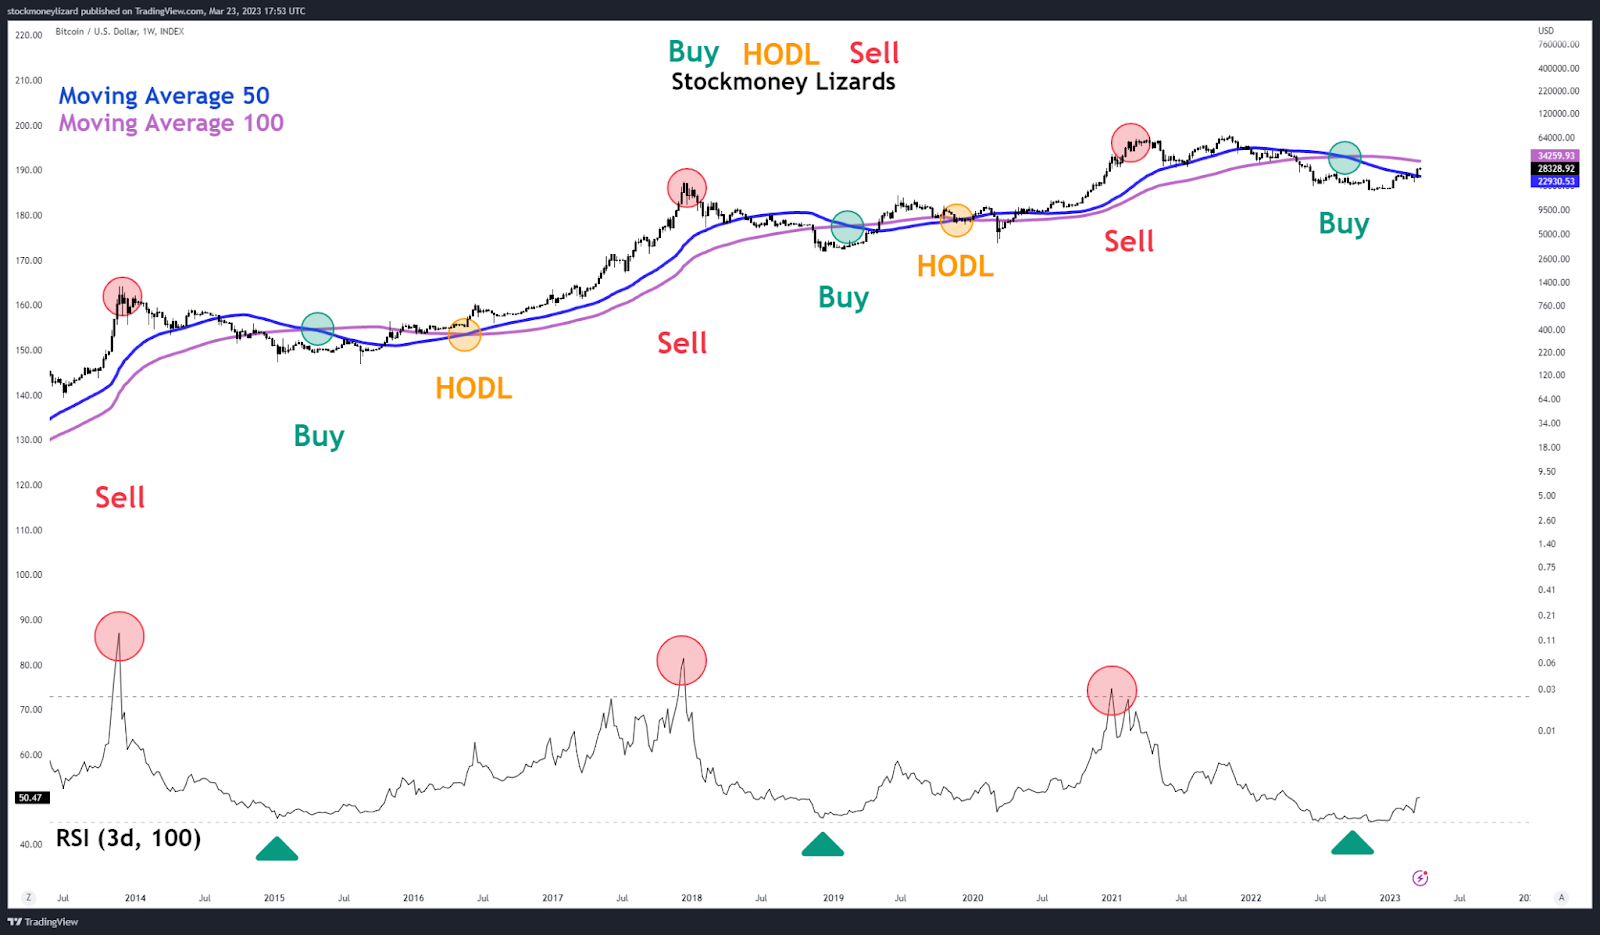
As you can see in the chart, you don't need many settings. Let's go through them one by one.
1. Set the time window to weekly
2. You need two moving averages: Moving Average (MA) 50 and 100
3. Relative Strength Index. Here you set "length" to 100 and "source" to 3 days.
Whenever the MA 50 crosses under the MA 100, this is a good buy signal. The MA 50 / 100 crossover is a sign that the bull run is in full swing. If the RSI exceeds 70, then you should be cautious with re-buys in principle. Although the price can still run further, but we are already in the overbought area and a sale may be useful until the cycle repeats itself.
COIN OF THE WEEK - LITECOIN

Litecoin is a coin that was created in 2011 as a fork of the Bitcoin network. It was designed to be faster and cheaper to use for everyday transactions than Bitcoin. Like Bitcoin, Litecoin is decentralized and operates on a blockchain network. It has a limited supply of 84 million coins, four times the maximum supply of Bitcoin. It uses a different mining algorithm than Bitcoin, called scrypt, which is designed to be more resistant to ASIC mining. Currently, LTC is seeing increased buying interest.
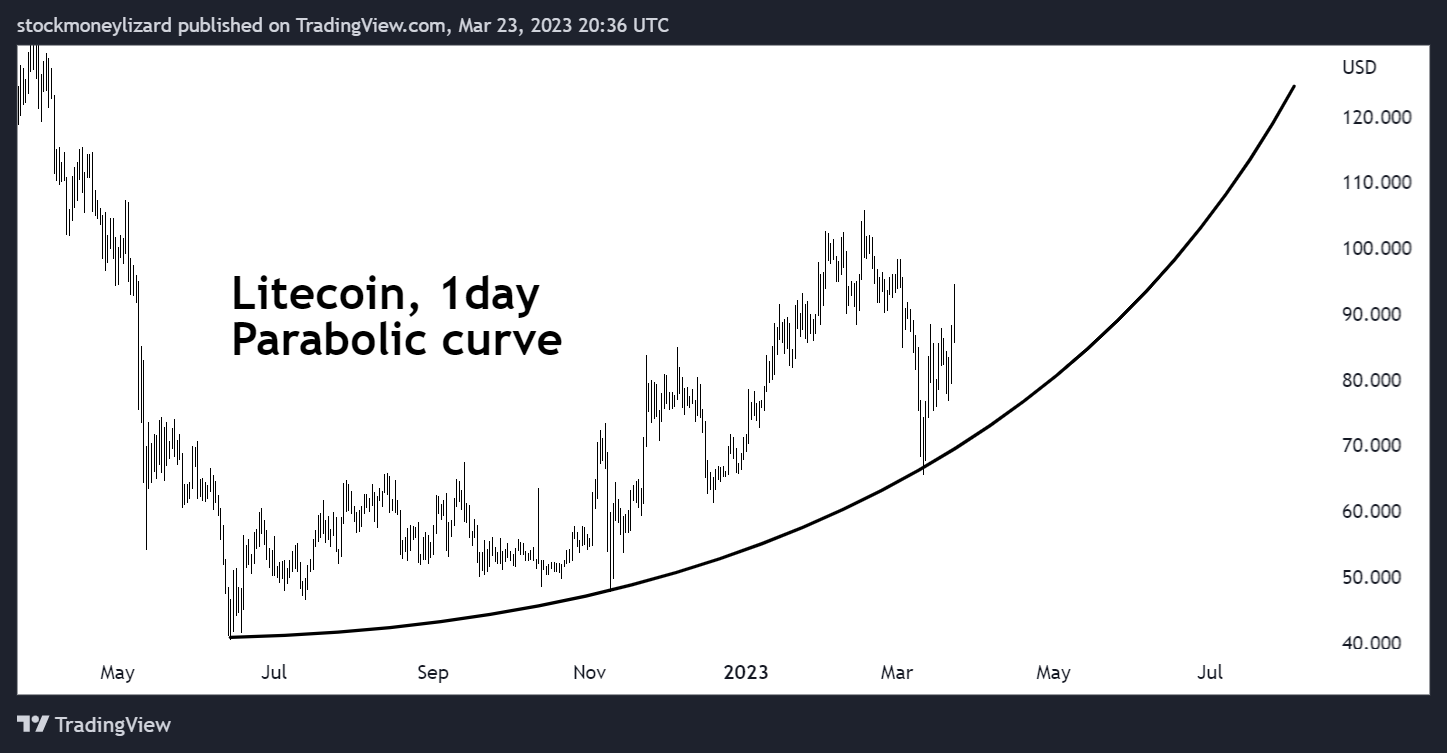
In an upward parabolic pattern, the price of an asset rises rapidly and then starts to accelerate upwards in a more steep and parabolic curve. This type of pattern is often seen as an indication of a bubble or a speculative frenzy, as it suggests that the price is being driven up by irrational exuberance rather than fundamental factors.
In a downward parabolic pattern, the price of an asset falls sharply and then starts to accelerate downwards in a more steep and parabolic curve. This type of pattern is often seen as an indication of a panic sell-off or a crash, as it suggests that the price is being driven down by fear and panic rather than fundamental factors.
Thanks for reading C.R.E.A.M.
Subscribe to receive new posts and support our work.
Disclaimer:
We may have beneficial long & short positions in any coin presented here. The posts here express our own opinions regarding trades. It’s no investment advice. We are not receiving compensation for it. All chart and prediction models are our own work and we believe they may help to better understand future price movements, however, those are just models which may be influenced by external factors and may not become true. Investing in the cryptocurrencies presented here is risky and may and in a complete loss of fortune.
Member discussion